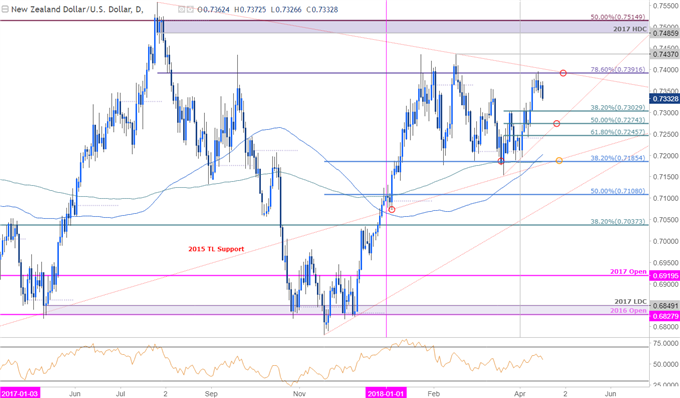
The New Zealand Dollar reversed sharply off the yearly high-day close at 7390 on Friday. The pullback is now testing initial areas of support, which if broken, could clear the way for a larger correction in price. For now, here are the levels to consider.
NZD/USD DAILY PRICE CHART

Technical Outlook: In this week's Technical Perspective, we highlighted that the Kiwi rally was, “eyeing range resistance at 7390 (yearly high-close)” with the immediate long-bias at risk while below this threshold. An outside-day reversal off this level on Friday further casts a near-term bearish outlook on price with daily momentum also pulling back from 60.
NZD/USD 120MIN PRICE CHART

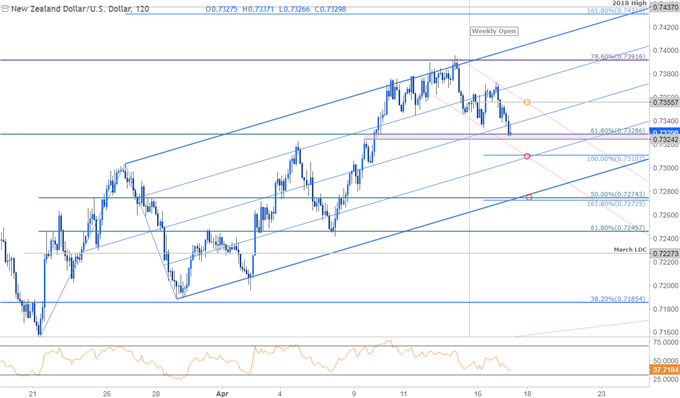
Notes: A closer look at price action sees NZD/USD trading within the confines of an ascending pitchfork formation extending off the March lows. The reversal off the upper parallel has continued to respect this embedded descending channel formation and keeps the near-term focus lower while below 7356 where the weekly open converges on the channel resistance. The decline is testing near-term support here at 7324/29 with more significant support eyed at 7310– a break there targets a larger correction towards median-line support ~7273/74.
Bottom line: Kiwi has reversed off upslope resistance and the burden of proof is on a break below parallel support to suggest a more significant high is in place. From a trading standpoint, I'll favor fading strength while below the weekly open. A breach above the weekly opening-range highs shifts the focus back towards key weekly resistance targets noted earlier at 73907431/37.
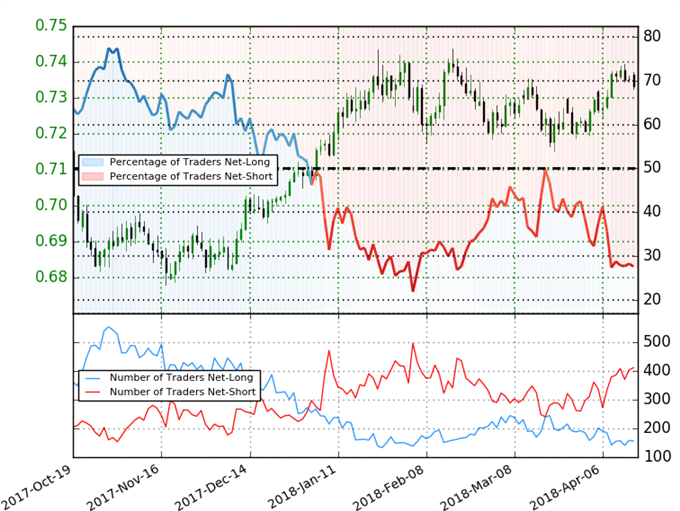
NZD/USD IG CLIENT POSITIONING


