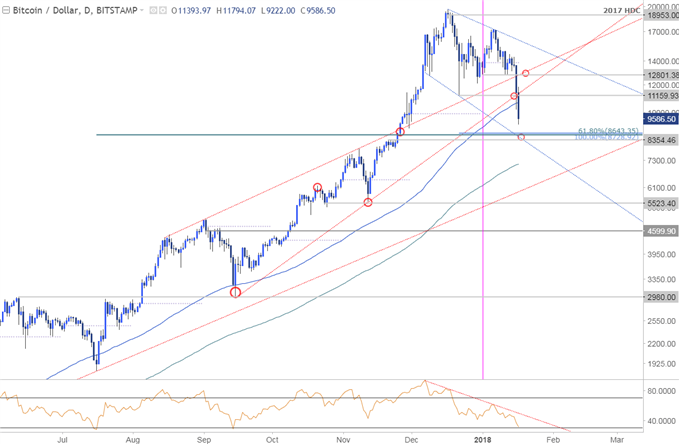
BTC/USD Daily Chart (Log)

Technical Outlook: Bitcoin broke a multi-month consolidation pattern off the December record highs with an objective break of the monthly opening-range lows/slope support unleashing a 30% sell-off in prices. The decline has taken out confluence support at 11160 with a near-term confluence support-zone eyed at 8354-8729. This is the first major hurdle for the sell-off and IF price is going to rebound, this would be the spot to look.
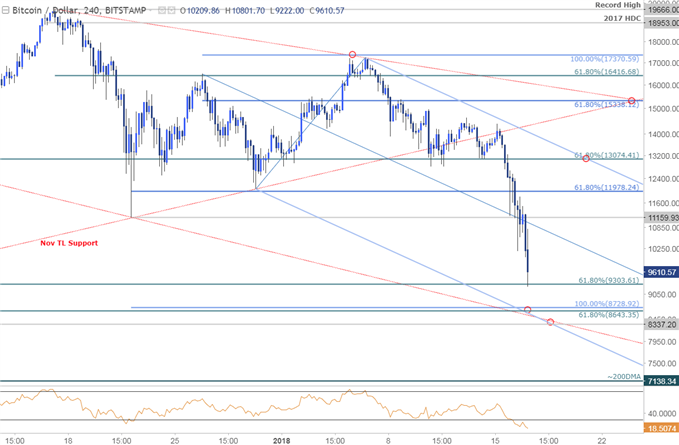
BTC/USD 240min Chart (Log)

Notes: A closer look at near-term price action highlights a rebound today off the 61.8% retracement of the September advance at 9303 with price broadly trading within the confines of a descending pitchfork formation. Subsequent support targets rest just lower at 8643-8729 backed by 8337– both areas IF reached would be of interest for near-term exhaustion/long-entries. A break / daily close below this threshold would risk considerable losses with such a scenario targeting the 200-day moving average around ~7138.
Interim resistance stands at 11160 backed by 11978 – and area of interest for re-entry on the short-side. Near-term bearish invalidation stands with the upper parallel at 13074– ultimately, a break above 15338would be required to mark resumption of the broader uptrend.
Bottom line: the immediate decline is at risk as we approach near-term structural support with a rebound in price to offer more favorable short-entries targeting the aforementioned support targets. From a trading standpoint, look for signs of a near-term exhaustion low in price for the rebound – but ultimately looking lower.


