USD/JPY Daily Chart

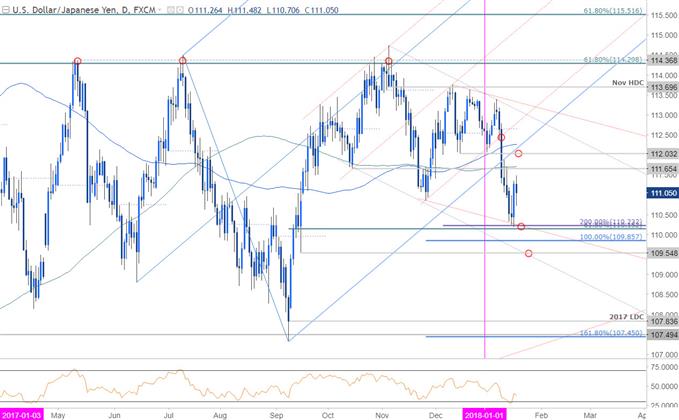
Technical Outlook: In this week's Technical Perspective, we highlighted a key near-term support confluence in USD/JPY while noting that, “price could see some rebound this week after this recent decline but the focus remains weighted to the downside while below the 200-week moving average which converges on the 2018 open at 112.50/65.”
Indeed prices posted a sharp outside-day reversal off the 110.15/23 support zone where the measured target of the December consolidation break converges on the 61.8% retracement of the September advance. Note that basic trendline support extending off the November lows also converges on this region and further highlights its technical significance.
USD/JPY 240min Chart

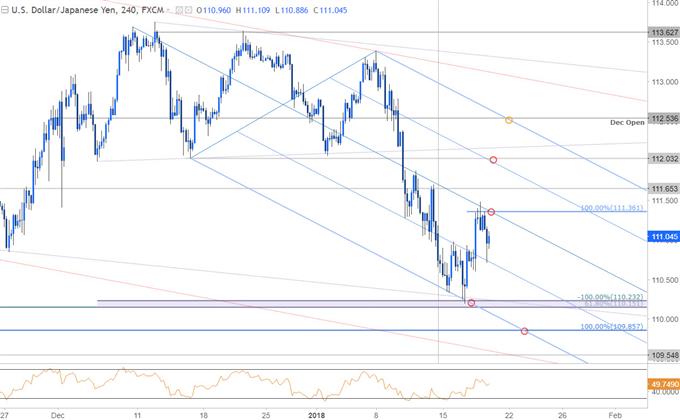
Notes: A closer look at price action sees he pair trading within the confines of a well-defined descending pitchfork formation extending off the December / January highs with the lower median-line parallel further highlighting the rebound off confluence support at 110.15/23. Interim resistance stands at 111.36 and a breach above this region would suggest a larger correction is underway with such a scenario targeting 111.65 and 112.03. Broader bearish invalidation is now lowered to 112.54.
Bottom line: the immediate risk is higher but ultimately a rally should offer more favorable short entries near structural resistance of the current downslope. A break below the weekly opening range lows would mark resumption with subsequent support targets eyed at 109.86 and 109.55.


