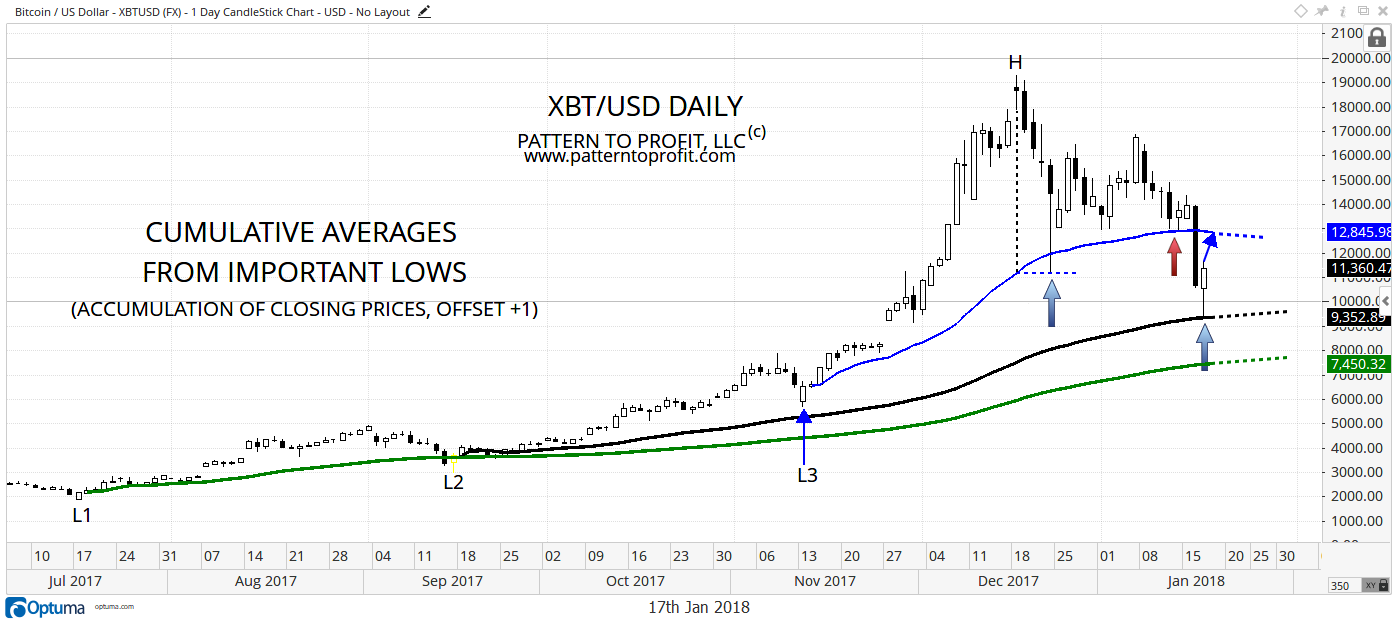
Bitcoin (XBT/USD) has rallied a little over 30% since bouncing off support of the second cumulative average ($9,260) indicator (black) that was noted in our analysis from the other day, January 13. The low of the current correction was roughly $9,209 (depending on your data source). At that point, bitcoin had fallen a little over 50% below the all-time high of around $19,666 hit five weeks ago. The recent decline also completed a 61.8% Fibonacci retracement nearby at $9,349, as measured from the uptrend starting at the September 2017 swing low.

Given bitcoin's recognition of cumulative averages historically and other proprietary analysis, there is now a good chance that the recent low may be a major low. If correct, weakness should be used to accumulate as the possibility of an eventual continuation of the long-term uptrend has improved.
If rather, the $9,209 low is exceeded to the downside then the next target becomes the lower cumulative average price support zone (green). That price zone would be from approximately $7,700 to $7,500.


