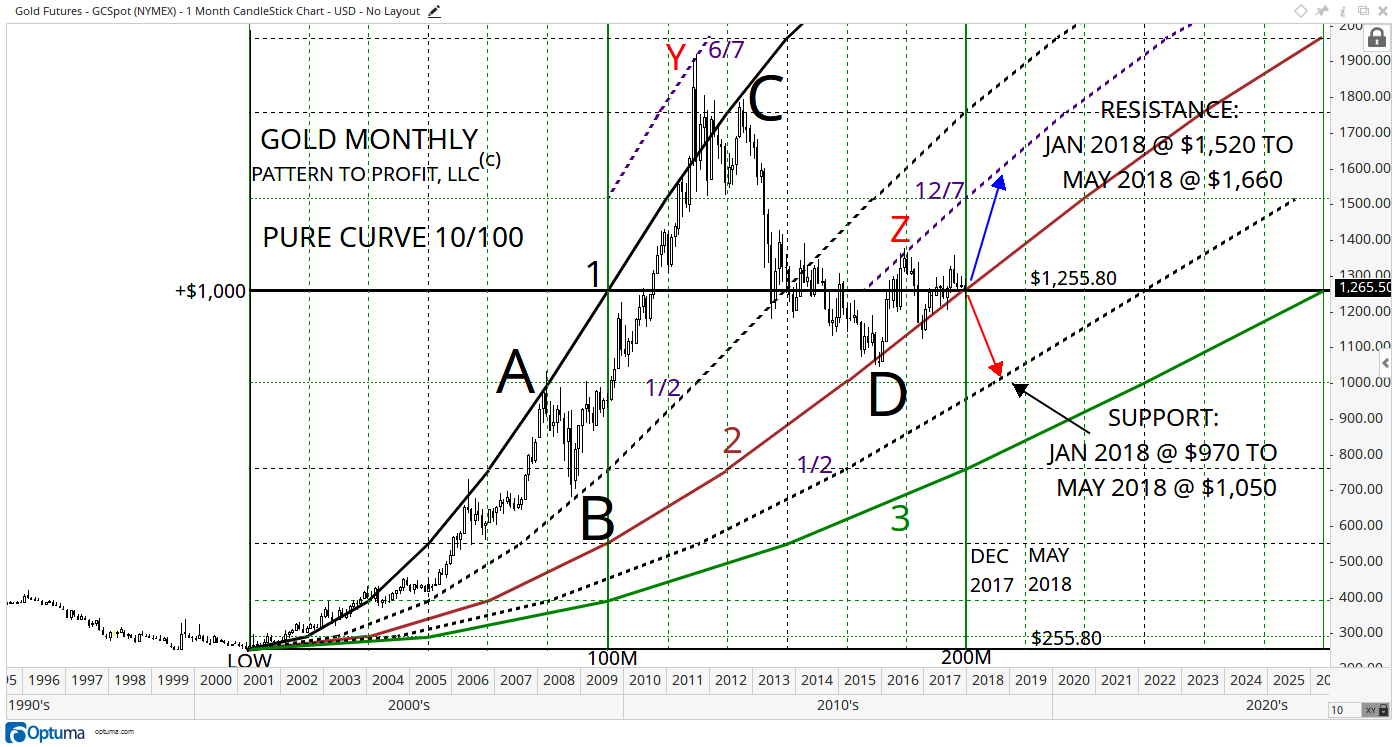
This possibility has long-term bullish implications from monthly geometric analysis, where the market is at a critical decision point.

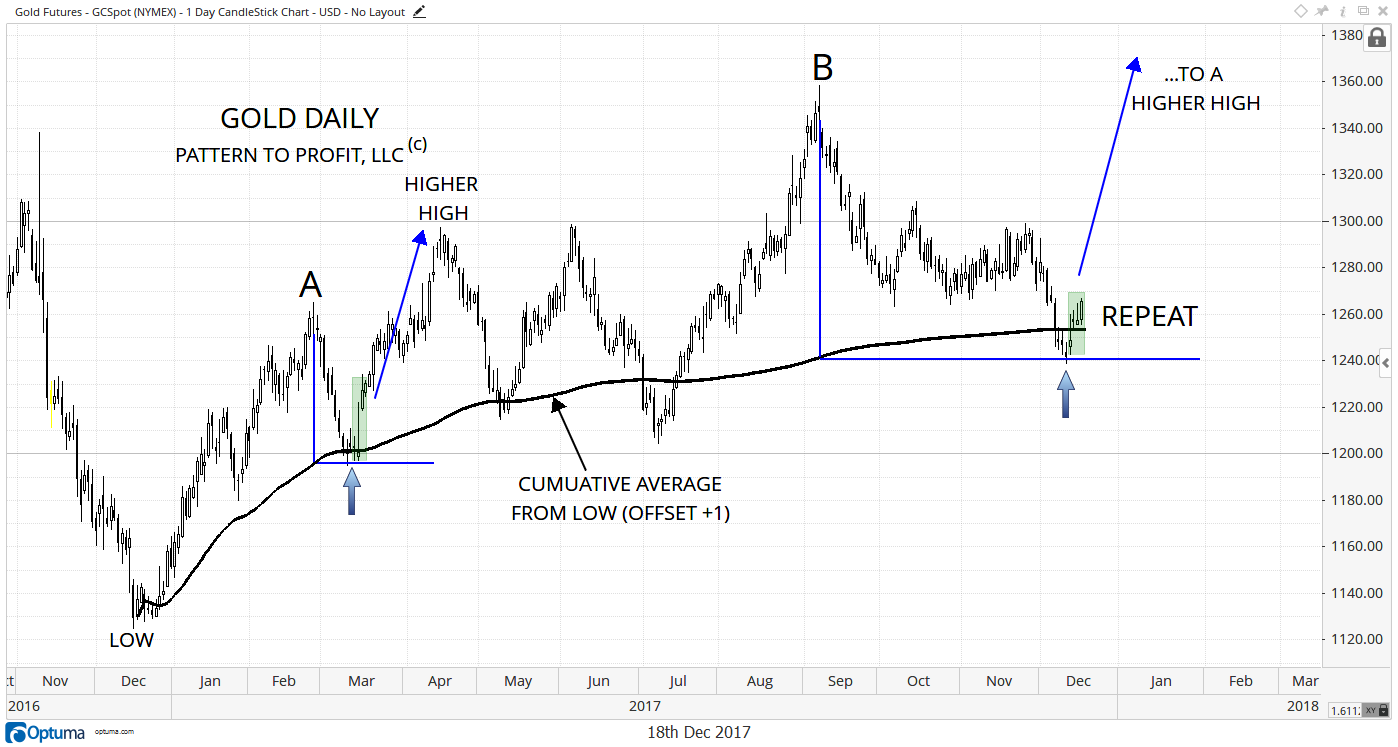
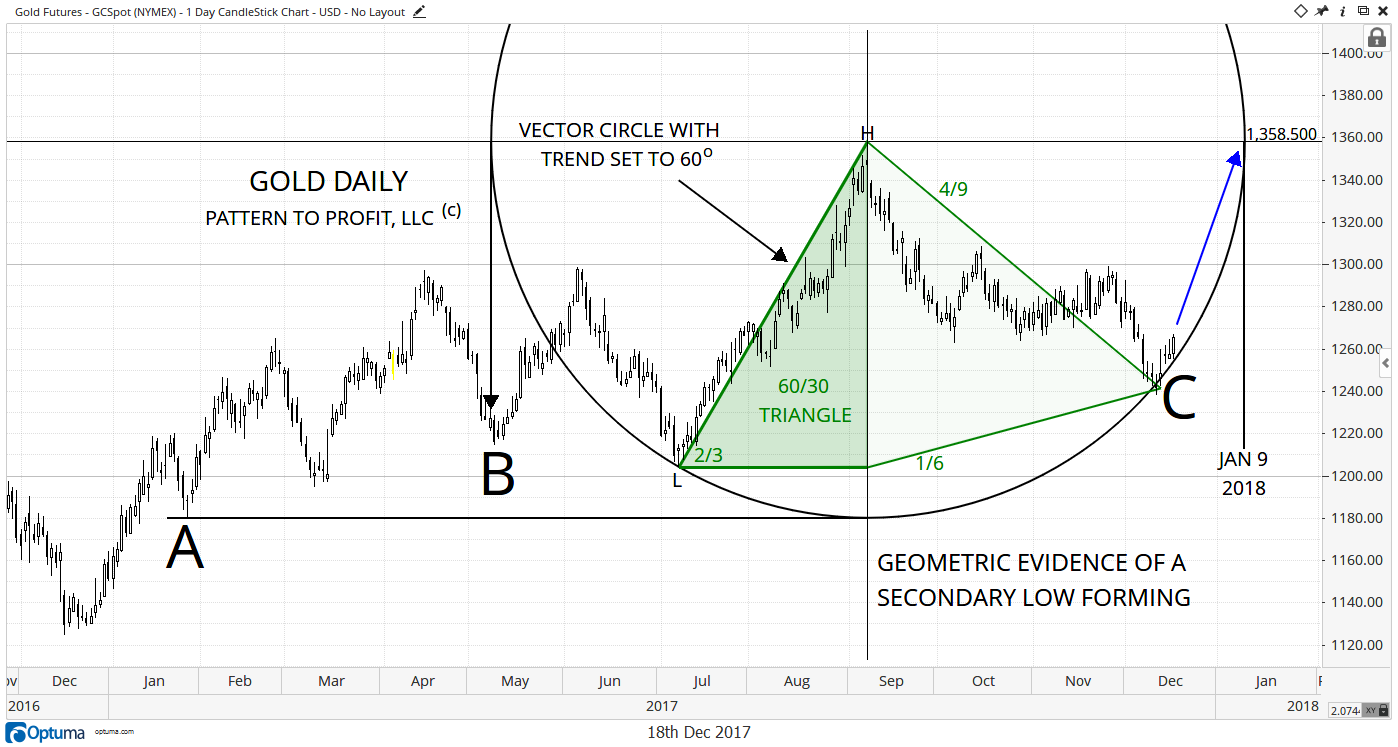
If this relationship holds, an eventual high above B ($1,358.50) can be expected.

A preceding downtrend (marked L-H) is set at 60o (2/3 of 90o) forming a ‘60/30' triangle (the angle of the high is 30o).
Therefore, we are bullish short-term on gold to at least the $1,360 area (making a higher high), with January 9, 2018 as a potential reversal day. At the same time there are some long-term bullish implications from this analysis.
The following monthly chart utilizes one of my applications of sine waves: in this case, the analysis is based on a ‘pure curve' of $1,000 over 100 months (labeled ‘1', solid black), stemming from the major low of $255.80 in April 2001:

Several dynamics are present in this sine wave analysis that point to a potential launch for gold:


