The BLS jobs report headlines from the establishment survey were strong and above expectations. The unadjusted data shows very strong jobs growth. Year-over-year growth rates are improving. The household survey again says something different.
Putting this month's headline establishment numbers into perspective – the monthly private sector growth is lower than last month but above average for 2014.
Unadjusted Non-Farm Private Employment – Year-over-Year Change (blue bars) and Year-over-Year Growth Acceleration / Deceleration (red line)

The unadjusted jobs added month-over-month was very strong (year-over-year comparisons).
economic intuitive sectors of employment were strong.
This month's report internals (comparing household to establishment data sets) AGAIN were extremely inconsistent with the household survey showing seasonally adjusted employment declining 273,000 vs the headline establishment number of growing 321,000. The point here is that part of the headlines are from the household survey (such as the unemployment rate) and part is from the establishment survey (job growth). From a survey control point of view – the common element is jobs growth – and if they do not match, your confidence in either survey is diminished. [note that the household survey includes ALL jobs growth, not just non-farm).
The monthly comment from the National Federation of Independent Business (NFIB) on jobs growth is below.
A summary of the employment situation:
BLS reported: 252K (non-farm) and 240K (non-farm private). Unemployment dropped from 5.8% to 5.6%.
ADP reported: 241K (non-farm private)
In Econintersect's December 2014 economic forecast released in late November, we estimated non-farm payroll growth at 170,000 (unadjusted based on economic potential) and 230,000 (fudged based on current overrun of economic potential).
The market expected:

The BLS reports seasonally adjusted data – manipulated with multiple seasonal adjustment factors, and Econintersect believes the unadjusted data gives a clearer picture of the jobs situation.
Non-seasonally adjusted non-farm payrolls rose 55,000 – the largest rise in the 21st century. Decembers are normally a contraction month for jobs.
Historical Unadjusted Private Non-Farm Jobs Growth Between Novembers and Decembers (Table B-1, data in thousands) – unadjusted (blue line) vs seasonally adjusted (red line)

Last month's seasonally adjusted employment was revised up .
Change in Seasonally Adjusted Non-Farm Payrolls Between Originally Reported (blue bars) and Current Estimates (red bars)

Most of the analysis below uses unadjusted data, and presents an alternative view to the headline data.
Unemployment
The BLS reported U-3 (headline) unemployment improved 0.2% to 5.6% with the U-6 “all in” unemployment rate (including those working part time who want a full time job) improved 0.2% to 11.2%. These numbers are volatile as they are created from the household survey.
BLS U-3 Headline Unemployment (red line, left axis), U-6 All In Unemployment (blue line, left axis), and Median Duration of Unemployment (green line, right axis)

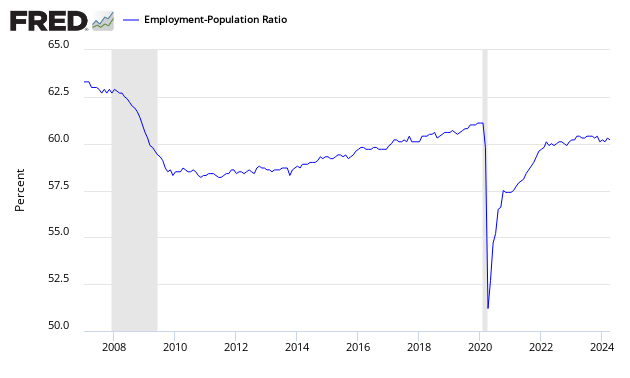
Econintersect has an interpretation of employment supply slack using the BLS unadjusted data base, demonstrated by the graph below. The employment-population ratio was unchanged at 59.2.
Employment-Population Ratio

The jobs picture when you view the population as a whole. This ratio is determined by household survey.
Econintersect uses employment-populations ratios to monitor the jobless situation. The headline unemployment number requires the BLS to guess at the size of the workforce, then guess again who is employed or not employed. In employment – population ratios, the population is a given and the guess is who is employed.
In this latest BLS report employment-population ratio was unchanged at 59.2 – this ratio has been in a general uptrend since the beginning of 2014. The employment-population ratio tells you the percent of the population with a job. Each 0.1% increment represents approximately 300,000 jobs. [Note: these are seasonally adjusted numbers – and we are relying on the BLS to get this seasonal adjustment factor correct]. An unchanged ratio would be telling you that jobs growth was around 150,000 – as this is approximately the new entries to the labor market caused by population growth.


