Real Interest Rates Are Back in Town
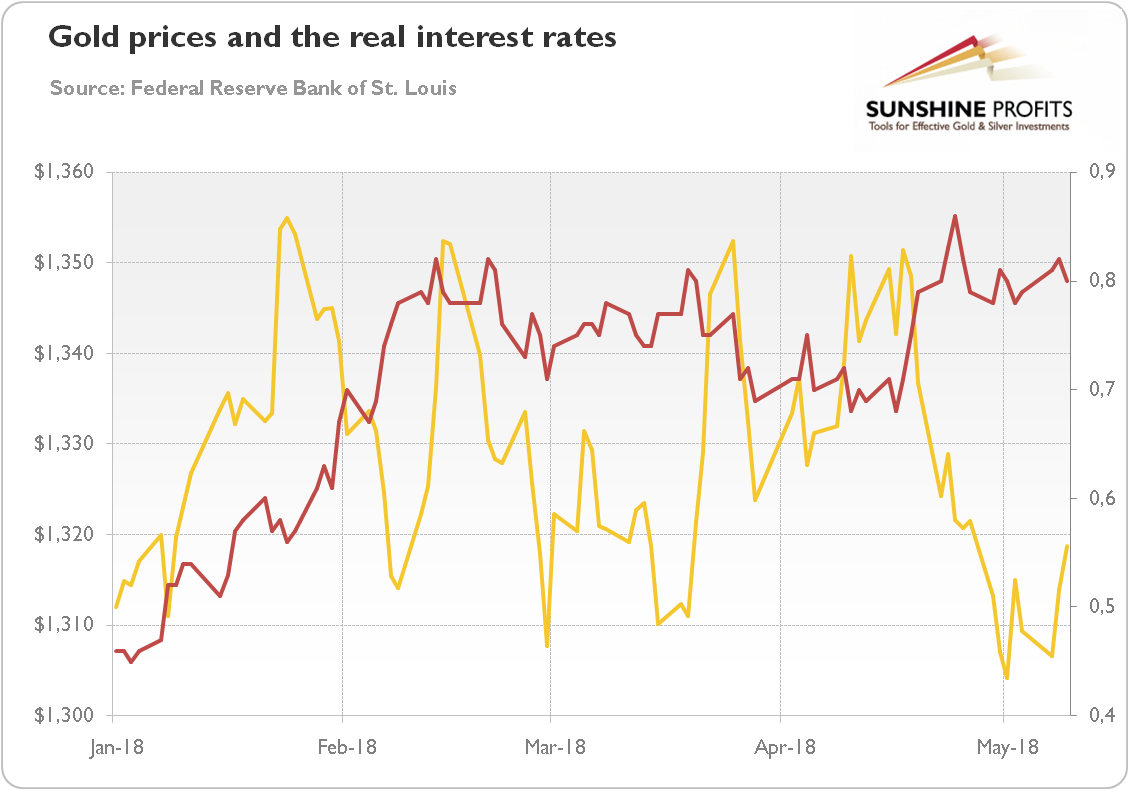
One of the biggest developments in the gold market during the first four months of 2018 was the breakdown of the traditional negative correlation between real interest rates and the price of bullion. As one can see in the chart below, the price of gold was uncorrelated or even moved in tandem with long-term, inflation-indexed U.S. Treasury yields in Q1 2018.
Chart 1: Price of gold (yellow line, left axis, P.M. London Fix) and U.S. real interest rates (red line, right axis, yields on 10-year Treasury Inflation-Indexed Security) in 2018.

However, the correlation has recently turned negative again. This is why we warned our Readers in the latest edition of the Market Overview: “if the old relationship comes back again, the price of gold may go south.” We argued that the weak u.s. dollar supported bulls, despite rising interest rates. But we cautioned investors that “at some point, the greenback may rebound – and then, the negative relationship between the U.S. real interest rates and the price of gold may return.” This is exactly what happened. The greenback has broken out of its downward spiral and the negative correlation between the yellow metal and real interest rates reestablished itself. In consequence, the price of gold declined in mid-April.
What's Next for Dollar?
Now, the question arises: what's next? If the rally in the U.S. dollar continues, gold will come under sustained pressure. However, investors shouldn't be deceived by the recent greenback's rise. Surely, rising interest rates and the hawkish Fed support the U.S. dollar. Indeed, yield differentials favor continued strength in the dollar versus the euro, i.e., the biggest component of the U.S. Dollar Index. But that was also the case last year, and the greenback fell despite the widening divergence in interest rates in the U.S. and in the Eurozone.


