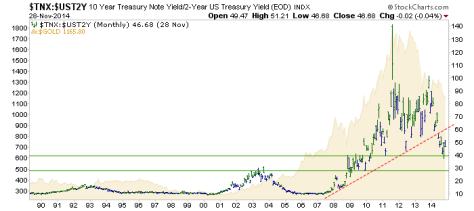
Here is the big picture view of the 10yr-2yr Treasury yield spread with gold shaded in the background. People who successfully get through this bear market in gold will have done so because they tuned out hype like Indian and China demand (funny how promoters always tout the demand but never the supply, unless ranting about paper gold sales) and the Swiss gold referendum (along with associated hysterical ranting by one Willem Buiter of Citi).
As we have noted for what is years now, gold was never going to go anywhere without the T bond yield curve's say so. Thus far it has not said so. But when it finds support, so too will the case for gold.

Sharp observers will counter with the fact that policy has meddled with the curve and so the signal is not valid. Well yes it is valid because gold has followed the signal ever since Operation Twist was initiated.
The Fed sold short-term notes and bought long-term bonds thereby “sanitizing” (the Fed's own word, not mine) inflation right out of the picture. It was maniacal, IMO evil and it has worked perfectly since first perpetrated in 2011.
Now, amidst a growing contrarian setup as we enter 2015, let's watch the curve among several other financial and economic indicators.


