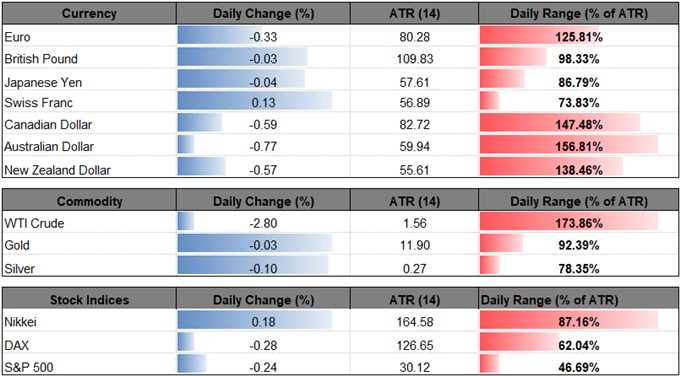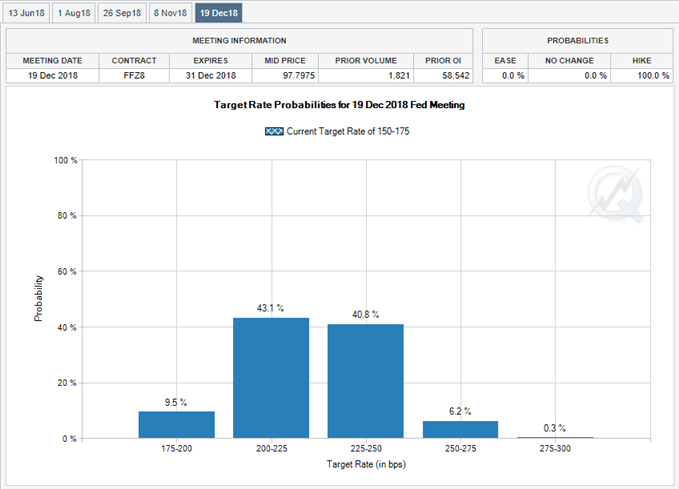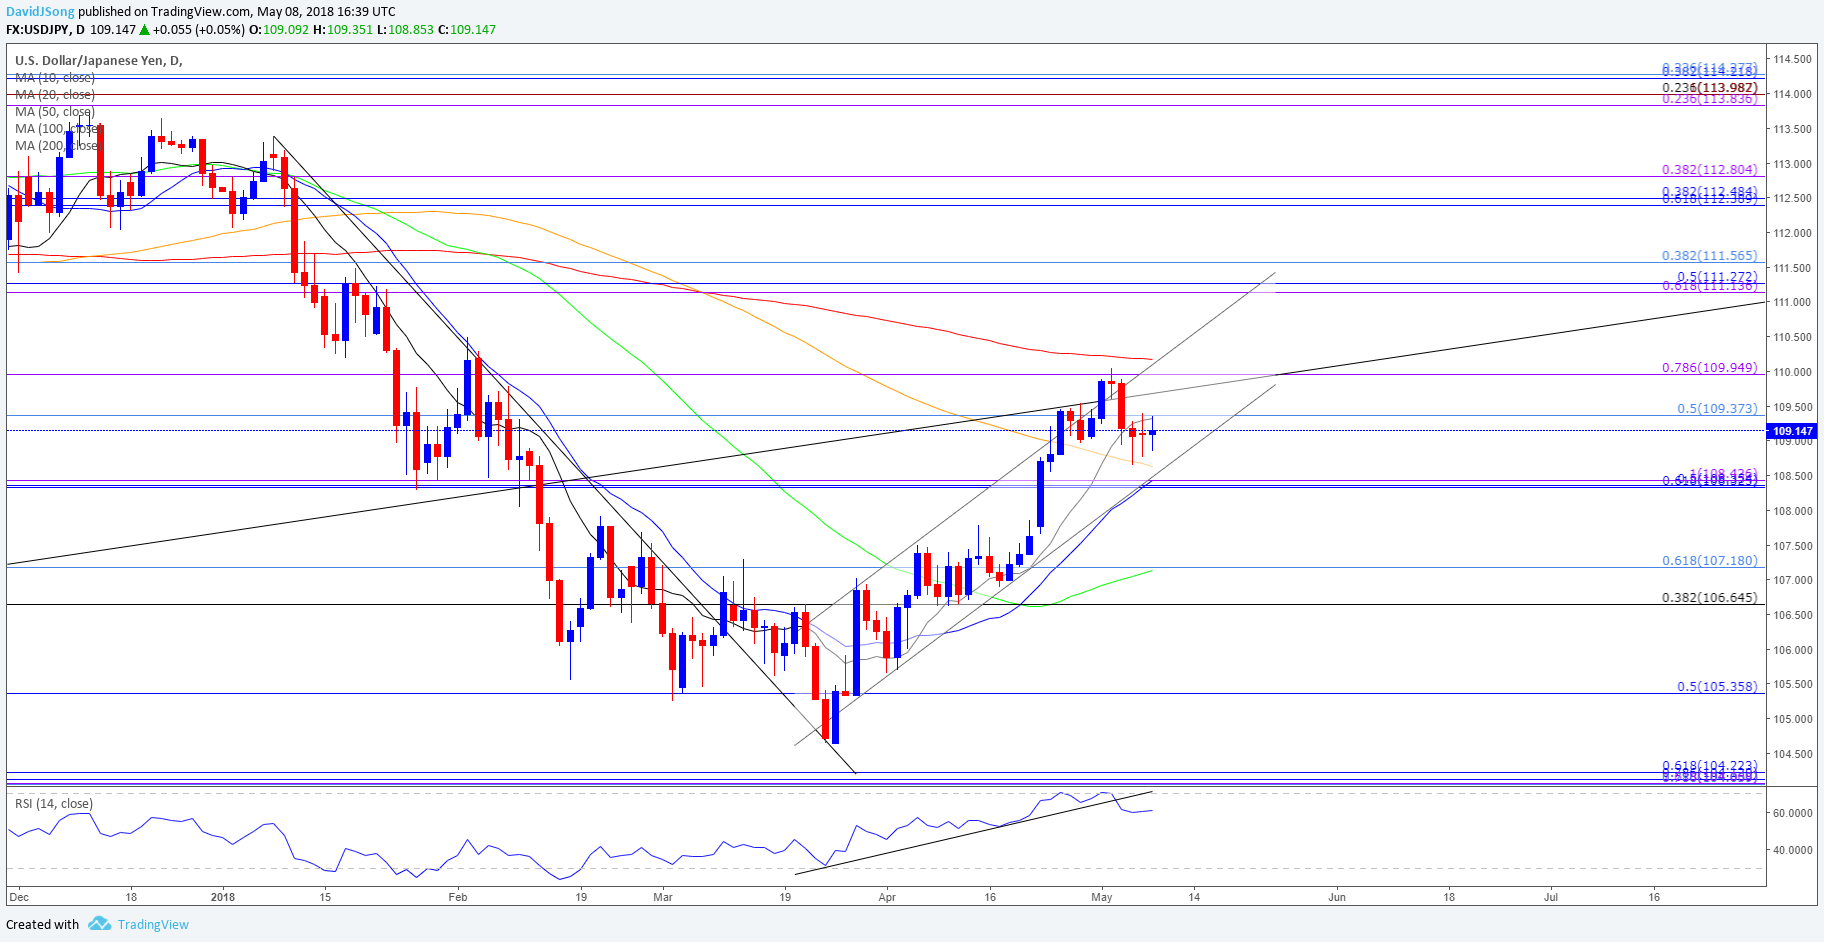
The u.s. dollar continues to gain ground against most of its major counterparts as there appears to be little in the way to deter the Federal Open Market Committee (FOMC) from further normalizing monetary policy over the coming months. However, the USD/JPY rate bucks the recent trend as it holds a narrow range, with dollar-yen at risk of exhibiting a more bearish behavior as the rebound from the 2018-low (104.63) appears to have run its course.
USD/JPY HOLDS NARROW RANGE EVEN AS CHAIRMAN POWELL ENDORSES HIKING-CYCLE

Unlike its major counterparts, USD/JPY holds a narrow range following fresh remarks from Fed Chairman Jerome Powell, with the pair at risk of tracking sideways ahead of the key data prints due out later this week as the bullish momentum unravels.

Comments from Chairman Powell suggest the FOMC will continue to implement higher borrowing-costs this year as ‘market participants' expectations for policy seem reasonably well aligned with policymakers' expectations,' but the committee appears to be in no rush to expand the hiking-cycle as the central bank head warns ‘risk sentiment will bear close watching as normalization proceeds around the world.'
With that said, Atlanta Fed President Raphael Bostic and Cleveland Fed President Loretta Mester, both voting-members on the FOMC this year, may also strike a balanced tone, and the remarks may do little to boost bets for four rate-hikes as the central bank pledges to tolerate above-target inflation for the foreseeable future.
USD/JPY DAILY CHART


