It was exactly 6 months since we caught the near blowoff top in Bitcoin. We did document this in our Bitcoin price forecast of $160,000, and we mentioned that a consolidation of 3-6 months was to be expected. We also caught the top in another article published on Dec 31. So far, Bitcoin has moved exactly in line with our expectation. Consequently, Bitcoin arrived at a very important juncture, it's fair to say this a crossroad. Recently, Bitcoin prices are flat, so what's next is the question at top of mind.
Where do we go from here is the million dollar question in investors' minds.
At the time of writing price has retraced ~65% since the Bitcoin top in December 2017. Does it mean investors can buy it cheap now? That may be the case with one caveat: what is cheap may become cheaper. Is the current state of things bullish (buy now) or bearish (wait for lower prices before getting in)?
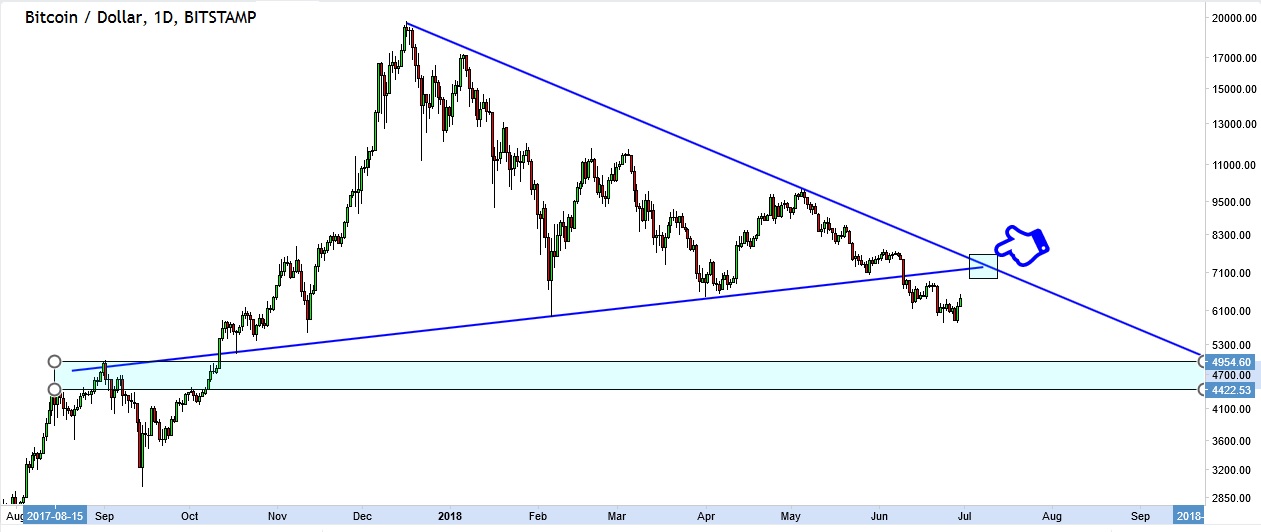
Bitcoin's daily price chart 6 months after the blow off top
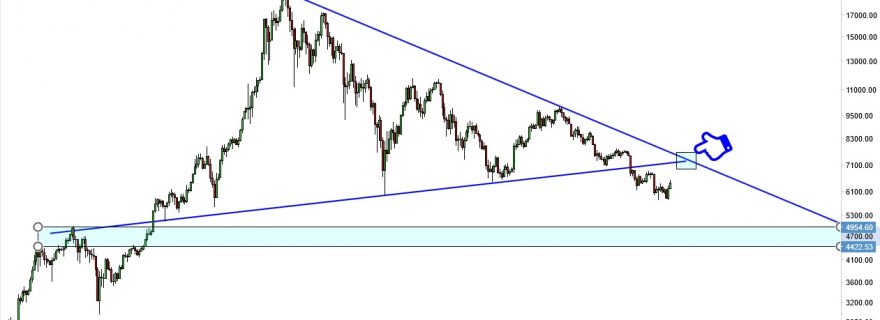
The daily chart shows the bullish case: the price of Bitcoin is likely to challenge the ~7255 area sooner rather than later. What happens in that area will be telling: if it can break the downtrend line it would be a hugely bullish sign, and the breakout might result in the start of the new uptrend. If that were to happen it would be exactly as forecast in this article many months ago: Bitcoin Falling Through Support. Now What?
The bearish case would kick in if Bitcoin's price falls through the $6000 mark as that's the most important psychological price point. If this level gives away, we may see strong support in the 4422 – 4954 area.

Bitcoin's long term price chart
Zooming out, we also considered “what if” a price breakdown takes place. Although we do not forecast this will happen, nor are we saying there is a high probability of this to happen, but there are several more support levels, ultimately the 1860 – 2980 area and the rounding consolidation zone of 1150 – 1300 area.


