TM editors' note: This article discusses a penny stock and/or microcap. Such stocks are easily manipulated; do your own careful due diligence.
Unlike many analysts, Joe Mazumdar of Canaccord Genuity does not expect a substantially higher gold price any time soon. So what are hard-pressed gold investors to do? In this interview with The Gold Report, Mazumdar argues that they should seek high-grade resources—usually underground—in stable jurisdictions that benefit from the strong American dollar. And he highlights seven near-term developers that offer exactly that.

Chart: Gold prices (USD) with 14-day relative strength index (RSI) and Chicago Board Options Exchange Volatility Index (VIX) as proxy for market volatility
The Gold Report: The price of gold flirted with $1,300 per ounce ($1,300/oz) in January. In July, it fell below $1,100/oz. What happened?
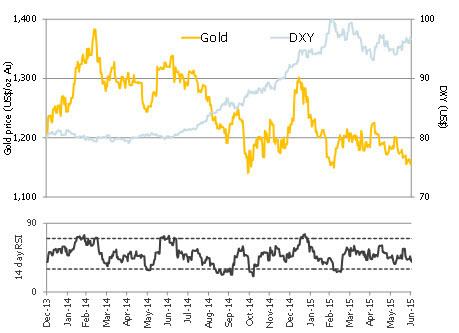
Joe Mazumdar: Gold began 2015 at $1,184/oz. So, year to date it's down about 8% in U.S. dollars. And one of the primary reasons for that is the strength of the u.s. dollar, underpinned by an economic rebound and the anticipation of an interest rate hike in the latter part of 2015. From January to July 2015, the U.S. dollar as proxied by the trade-weighted index, the U.S. Dollar Index (DXY), was up by the same amount as the U.S. dollar-denominated gold price was down, 8%.
Figure 1: Gold prices (USD) with 14-day relative strength index (RSI) and US Dollar Index (DXY) as proxy for USD performance
Source: Bloomberg
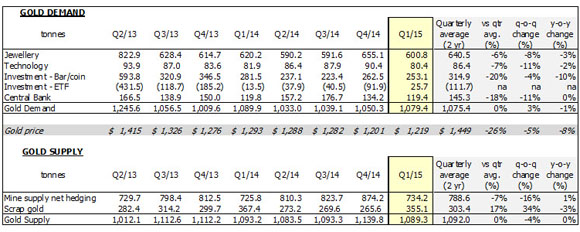
Gold's sideways to downward trend is underpinned by weak demand fundamentals. Overall Q1/15 demand—1,079.4 tonnes—as provided by the World Gold Council, was in line with the last two-year quarterly average. However, jewelry demand, which represents about 55% of overall demand, was down 6% versus the two-year quarterly average, down 8% quarter-on-quarter and down 3% year-on-year. Investment gold, such as bars and coins, which represents about 23% of overall demand, was down 20% in Q1/15 versus the two-year quarterly average.
Figure 2: Gold demand and supply from Q2/13 to Q1/15
Source: World Gold Council Demand Trends Q1/2015 and Canaccord Genuity estimates
TGR: Are the central banks still buying?
JM: Purchases in the last documented quarter, Q1/15, were about 119 tonnes, so still positive. However, that is down 18% versus the two-year quarterly average. Of note, there was a positive inflow of ~26 tonnes in exchange-traded funds (ETFs) during Q1/15, the first net inflow in a protracted period of time. The two-year quarterly average for ETF investments was a net withdrawal of about 111 tonnes. So much of the negative demand equation was offset by that net inflow. We don't believe that we will see the same positive impact from ETF investments in Q2/15, however.
TGR: Is continued gold production threatened by a gold price under $1,100/oz?
JM: We highlight that the Q1/15 mine supply net of hedging, 734.2 tonnes, according to the World Gold Council, was down 7% versus the two-year quarterly average. The only reason overall demand remained flat—1,089.3 tonnes—versus the two-year quarterly average was a spike in the supply of scrap gold (+17% versus two-year quarterly average, 355.1 tonnes).
The impact of a lower gold price on mine supply lays the foundation for a healthier gold market in the medium to long term. We highlight that over the next 5–10 years, production curtailments combined with the lack of capital spent on development projects and significant cut backs in exploration expenditures will challenge future mine supply. The paucity of projects may drive future M&A bids for junior companies with quality assets in manageable jurisdictions that are currently well funded to production due in part to the quality of the management team. In our opinion, these are the companies that investors should seek.
TGR: The gold price has collapsed during a period of burgeoning economic and geopolitical volatility. So is gold no longer a safe haven?
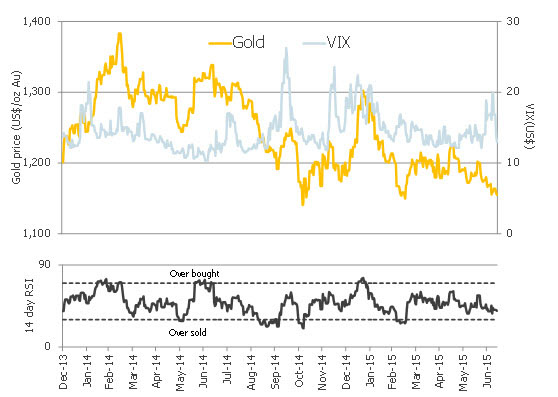
JM: Gold has recently lost some of its attraction as a safe-haven asset. Normally, a spike in market volatility as proxied by the Chicago Board Options Exchange Volatility Index (VIX) results in an uptick in safe-haven assets such as the U.S. dollar and the gold price. These assets are historically negatively correlated except for periods of high market volatility that generate a bid for safe-haven assets. We observed a spike in the Chicago Board Options Exchange Volatility Index (+40%) from Dec. 28, 2014, to Jan. 16, 2015, with a subsequent lift in the U.S. dollar, the gold price and the Market Vectors Junior Gold Miners ETF (GDXJ:NYSE.Arca), which has a large beta to gold.
Figure 3: Gold prices (USD) with 14-day relative strength index (RSI) and Chicago Board Options Exchange Volatility Index (VIX) as proxy for market volatility
Source: Bloomberg
From June 23 to about July 7, 2015, when the Greek crisis was at its peak, the Chicago Board Options Exchange Volatility Index spiked up 60%. But unlike the previous spike, gold was flat to down. Some cite the collapse of the Chinese stock market as a partial reason for the muted response from the gold price. When margins were called, investors had to sell liquid assets and this may have included gold holdings. This selling may have triggered further stop-loss selling in a low liquidity environment (summer market) placing further downside pressure on the gold price. The current sentiment remains pessimistic as investors increased their short positions in gold.
TGR: The price of gold falls in U.S. dollars even as the U.S. dollar rises against other currencies. So does this mean that Canada and other non-American mining jurisdictions, such as Australia, are riding out this storm?
JM: Yes. At the start of the year, one U.S. dollar was worth CA$1.16. It's now worth CA$1.30. So the Canadian dollar is down 12–13% in 2015, which means that the gold price in Canadian dollars is actually up 3–4%. So we favor miners with high-grade Canadian assets.
TGR: Given that Canadian gold producers still make money, and their market caps are discounted by 30%, can we expect a flurry of takeovers?
JM: Yes, but we suspect that this might be put off while investors and potential merger and acquisition (M&A) suitors wait for the Canadian dollar to fall even further. Note federal elections in Canada are planned for Oct. 19, 2015. The current polls suggest that the right-leaning Conservative party and the left-leaning New Democratic Party are neck and neck. The potential for a minority or coalition government with an economy teetering on recession due in part to a weak commodity complex could place further pressure on the Canadian dollar.
TGR: Will much of this M&A activity come from China?
JM: Chinese state-funded organizations are definitely interested in gold-copper assets. An executive director of Zijin Mining Group Co. (601899:SHA), George Fang, has stated that “gold is our game.” Zijin Mining Group began 2015 by acquiring a 9.9% stake in Pretium Resources Inc. (PVG:TSX; PVG:NYSE) for CA$80 million (CA$80M) in January. In March 2015, the state-owned company purchased a 9.9% stake in Ivanhoe Mines Ltd. (IVN:TSX│Not rated) for CA$105M (US$83M). Subsequently, in May 2015, Zijin Mining agreed to co-develop the Kamoa copper project by acquiring a 49.5% stake in the project for US$412M.


