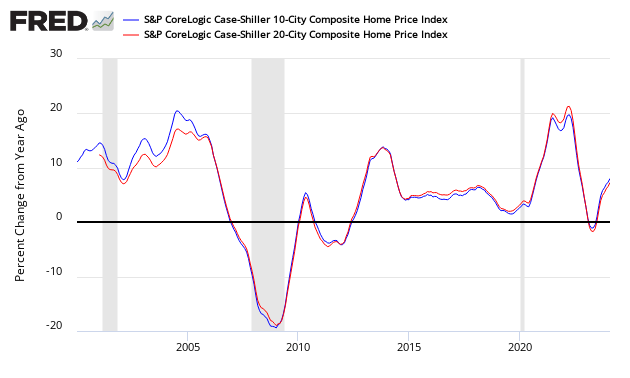
The non-seasonally adjusted Case-Shiller home price index (20 cities) year-over-year rate of home price growth was unchanged from last month's 5.7%. The authors of the index say “While rising home prices are certainly a factor deterring home purchases, individual financial positions are more important than local housing market conditions”

S&P/Case-Shiller Home Price Indices Year-over-Year Change

Comparing all the home price indices, it needs to be understood each of the indices uses a unique methodology in compiling their index – and no index is perfect. The National Association of Realtors normally shows exaggerated movements which likely is due to inclusion of more higher value homes.
Comparison of Home Price Indices – Case-Shiller 3 Month Average (blue line, left axis), CoreLogic (green line, left axis) and National Association of Realtors 3 Month Average (red line, right axis)
z existing3.PNG
The way to understand the dynamics of home prices is to watch the direction of the rate of change. Here home price growth generally appears to be stabilizing (rate of growth not rising or falling).
Year-over-Year Price Change Home Price Indices – Case-Shiller 3 Month Average (blue bar), CoreLogic (yellow bar) and National Association of Realtors 3 Month Average (red bar)
z existing5.PNG
There are some differences between the indices on the rate of “recovery” of home prices.


