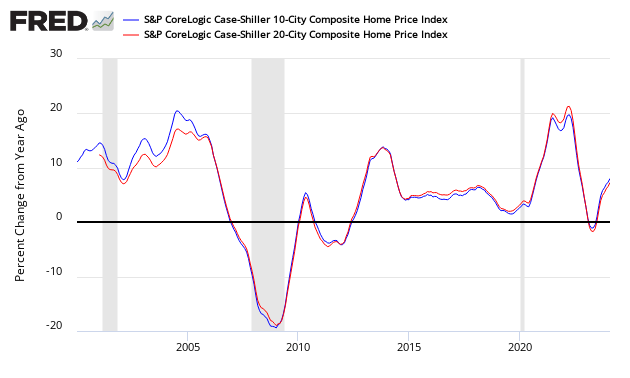
The non-seasonally adjusted Case-Shiller home price index (20 cities) for October 2014 (released today) year-over-year rate of home price growth slowed from 4.8% (reported as 4.9% last month) to 4.5%.


S&P/Case-Shiller Home Price Indices Year-over-Year Change

Comparing all the home price indices, it needs to be understood each of the indices uses a unique methodology in compiling their index – and no index is perfect. The National Association of Realtors normally shows exaggerated movements which likely is due to inclusion of more higher value homes.
Comparison of Home Price Indices – Case-Shiller 3 Month Average (blue line, left axis), CoreLogic (green line, left axis) and National Association of Realtors 3 Month Average (red line, right axis)
The way to understand the dynamics of home prices is to watch the direction of the rate of change. Here home price growth generally appears to be stabilizing (rate of growth not rising or falling).
Year-over-Year Price Change Home Price Indices – Case-Shiller 3 Month Average (blue bar), CoreLogic (yellow bar) and National Association of Realtors 3 Month Average (red bar)
There are some differences between the indices on the rate of “recovery” of home prices.
A synopsis of Authors of the Leading Indices:
Case Shiller's David M. Blitzer, Chairman of the Index Committee at S&P Indices:
After a long period when home prices rose, but at a slower pace with each passing month, we are seeing hints that prices could end 2014 on a strong note and accelerate into 2015. Two months ago, all 20 cities were experiencing weakening annual price increases., Last month, 18 experienced weakness. This time, 12 cities had weaker annual price growth, but eight saw the pace of price gains pick up. Seasonally adjusted, all 20 cities had higher prices than a month ago.
Most national economic statistics, other than those connected to housing, posted positive reports in November and early December. Third quarter GDP was revised to 5% real growth at annual rates, and unemployment was at 5.8% as payrolls added over 300,000 jobs in November. Housing was somber: housing starts pulled back 1.6%, existing home sales were at 4.93 million, down 6.1%, and new home sales were 438,000, down 1.6%, all in November.


