Crude oil and gold prices found little impetus for trend development over the past 24 hours, languishing within familiar congestion ranges. Top-tier scheduled event risk is notably absent through the week-end, hinting that sentiment trends may emerge as the central driver of performance.
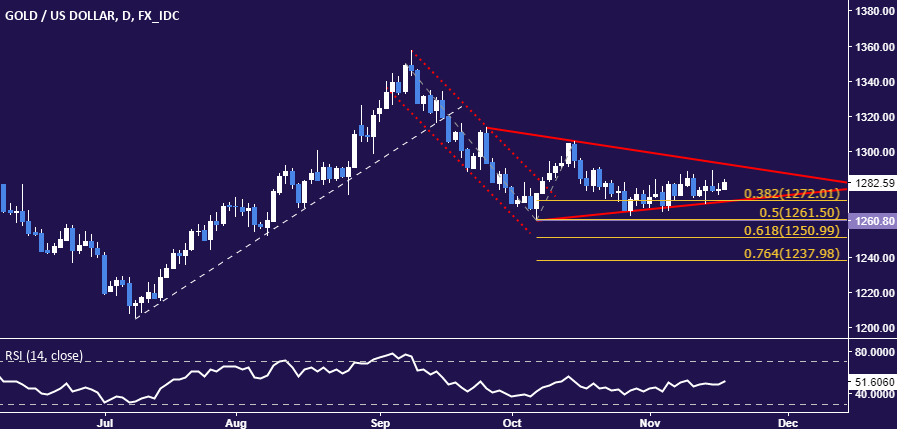
GOLD TECHNICAL ANALYSIS – Gold prices remain wedged within a would-be bearish Triangle chart pattern. A daily close below its lower boundary and the 38.2% Fibonacci expansion at 1272.01 sees the next downside barrier in the 1260.80-61.50 area (October 6 low, 50% level). Alternatively, a move above Triangle resistance – now at 1293.13– exposes the October 16 high at 1306.04.

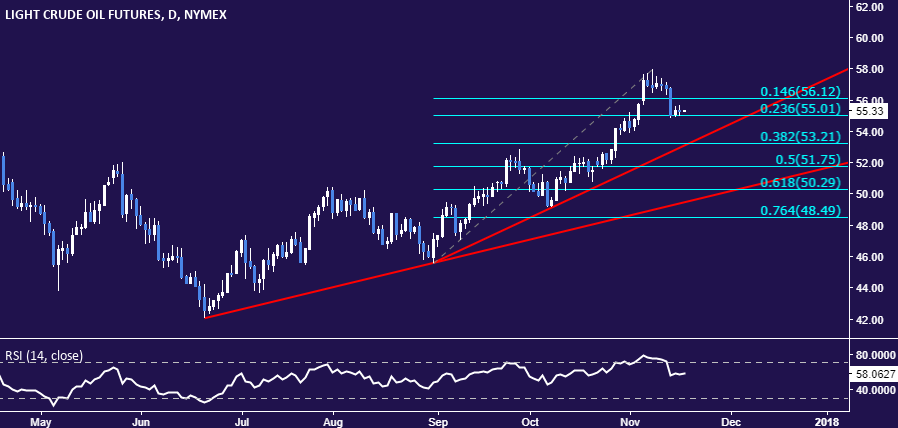
CRUDE OIL TECHNICAL ANALYSIS – Crude oil prices continue to mark time near the 23.6% Fibonacci retracement at 55.01. A daily close below that exposes the 38.2% level at 53.21. Alternatively, a reversal back above the 14.6% Fib at 56.12 opens the door for a retest of the November 8 high at 57.92.


