Crude oil prices rose after EIA inventory data showed raw material stocks shed 6.5 million barrels compared with a 3.48 million draw expected by the markets, while gasoline storage added 1.24 million last week, a smaller build than the 1.73 million median forecast.
From here, the API monthly report headlines the day's scheduled event risk. While it may help inform bets on next year's tug of war between OPEC-led output cuts and US shale growth, investors are probably reluctant to make substantive directional calls so close to the year-end.
Gold prices edged higher as market expectations for next year's Fed interest rate hike prospects cooled. The 2018 tightening path implied in Fed Funds futures flattened, boosting the appeal of non-interest-bearing assets epitomized by the yellow metal.
A revised set of US GDP figures might have left some impression on prices under normal circumstances, but they may well pass without much of a response this time. The Fed's upgraded growth outlook and the final passing of tax reform were generally overlooked, and this release ranks lower on the impact spectrum.
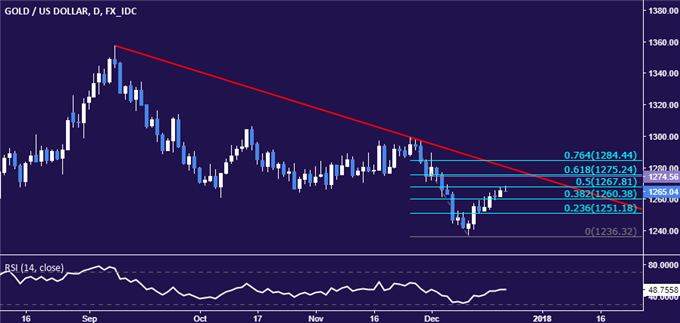
Gold Technical Analysis – Gold prices continue to recover, with the 50% Fibonacci retracement at 1267.81 now under fire. A daily close above that exposes the 1274.56-75.24 area (November 30 close, 61.8% level). Alternatively, a turn back below the 38.2% Fib at 1260.38 opens the door for a retest of the 23.6% retracement at 1251.18.

Chart created using TradingView
Crude Oil Technical Analysis – Crude oil prices remain locked within what looks like a Triangle chart pattern, a setup with bullish continuation in this scenario (if confirmed by a breakout). A daily close above the Triangle top (58.27) initially targets the 23.6% Fibonacci expansion at 59.83. Alternatively, a push below the pattern's lower boundary (56.41) exposes the 23.6% Fib retracement at 55.04.


