The Cryptocurrency carnage continued this week prices approaching or breaking to fresh yearly lows. While the broader technical picture keeps the focus lower, the declines are now approaching key near-term inflection levels in price. Here are the levels to know in Bitcoin, Ethereum, Ripple and Litecoin heading into the close of March trade.
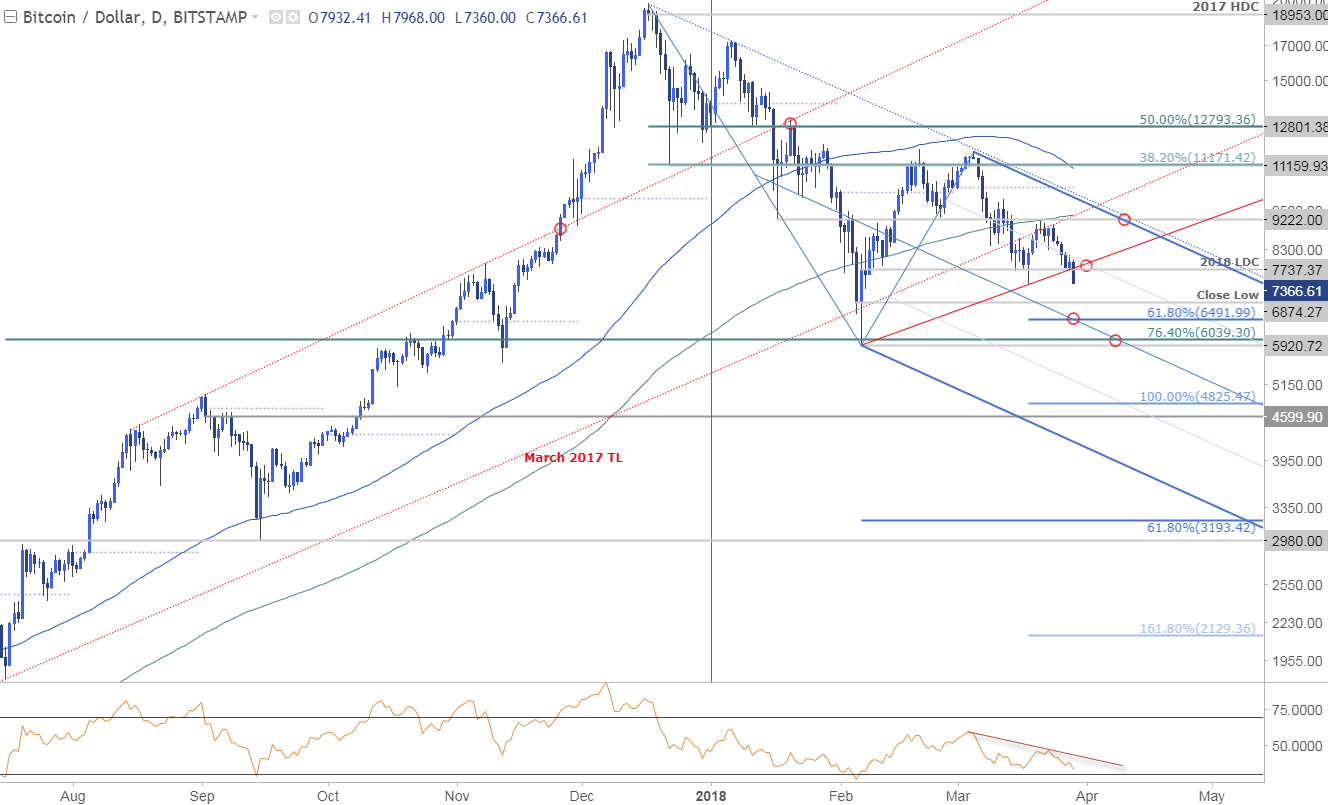
BITCOIN DAILY PRICE CHART (LOG)

Notes: Earlier this month we highlighted that Bitcoin prices had reversed, “sharply off the 2018 low-day close at 7737 (low registered at 7682) – It's make-or-break here for the cryptocurrency near-term.” Indeed price rallied into near-term resistance at 9222 before turning lower again with the decline now attempting to break the monthly lows.
If Bitcoin prices close at these levels, the risk remains for a larger decline towards support targets at the 2018 close low at 6874, the 61.8% extension at 6492 and the yearly low / 76.4% retracement at 5921-6039. Interim resistance now stands back at 7737 with broader bearish invalidation back at 9222-9360 where the 200-day moving average converges on slope resistance.
Bottom Line: Bitcoin prices remain at risk for further losses near-term while below 7737 and heading into the April open we'll be looking for a reaction at structural support for a possible recovery. All things held constant, Bitcoin looks like its heading lower- look for the weekly close for guidance here.
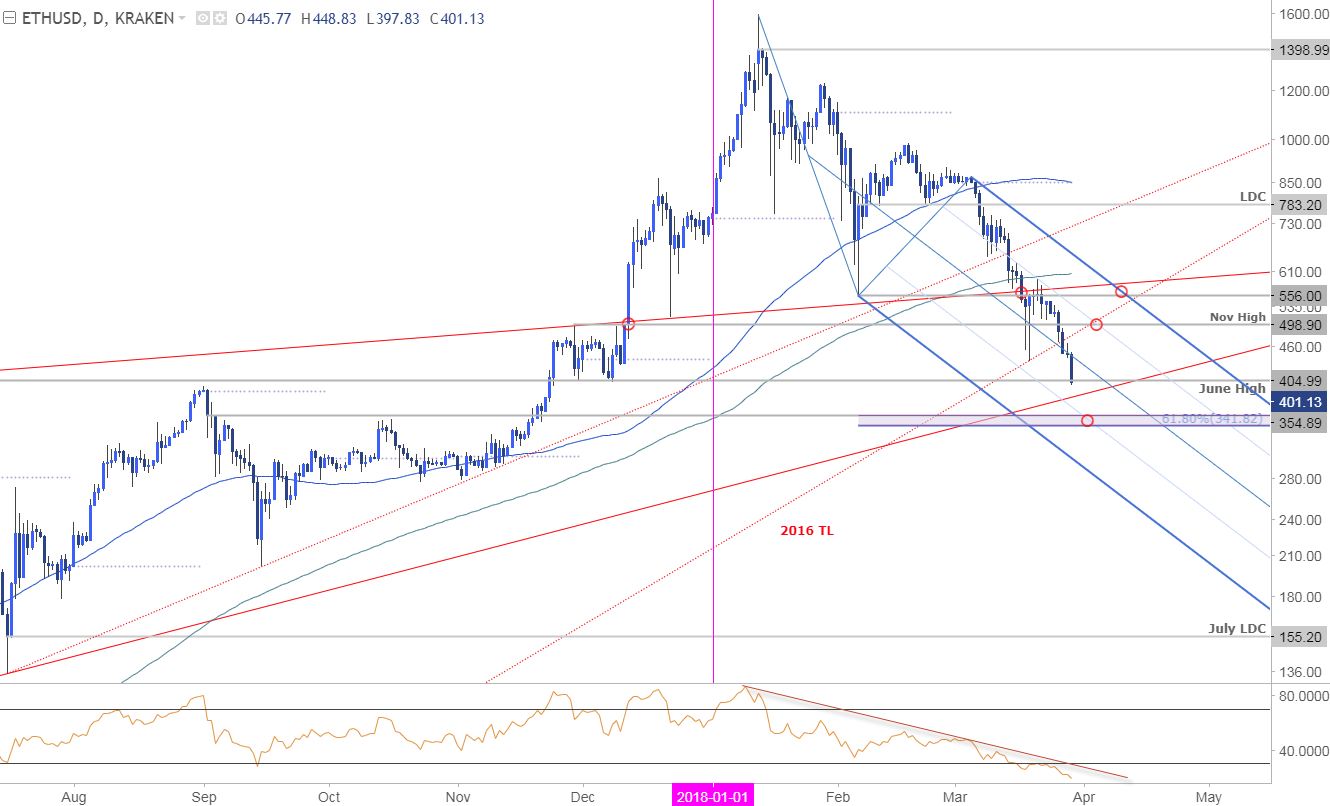
ETHER DAILY PRICE CHART (LOG)

Notes: In my previous Cryptocurrency Technical Outlook I noted that Ethereum prices where, “testing a critical near-term support confluence at 556 where the 2018 lows converges on a slope line extending off the June highs. Note that daily RSI is also testing 30 and a break below these levels would risk accelerated losses towards the November high at 499 and more a significant support confluence at 405/24.” Ether prices are testing this final support target now with a newly identified pitchfork keeping the immediate focus lower while below today's high.


