
ETH/USD Daily Chart
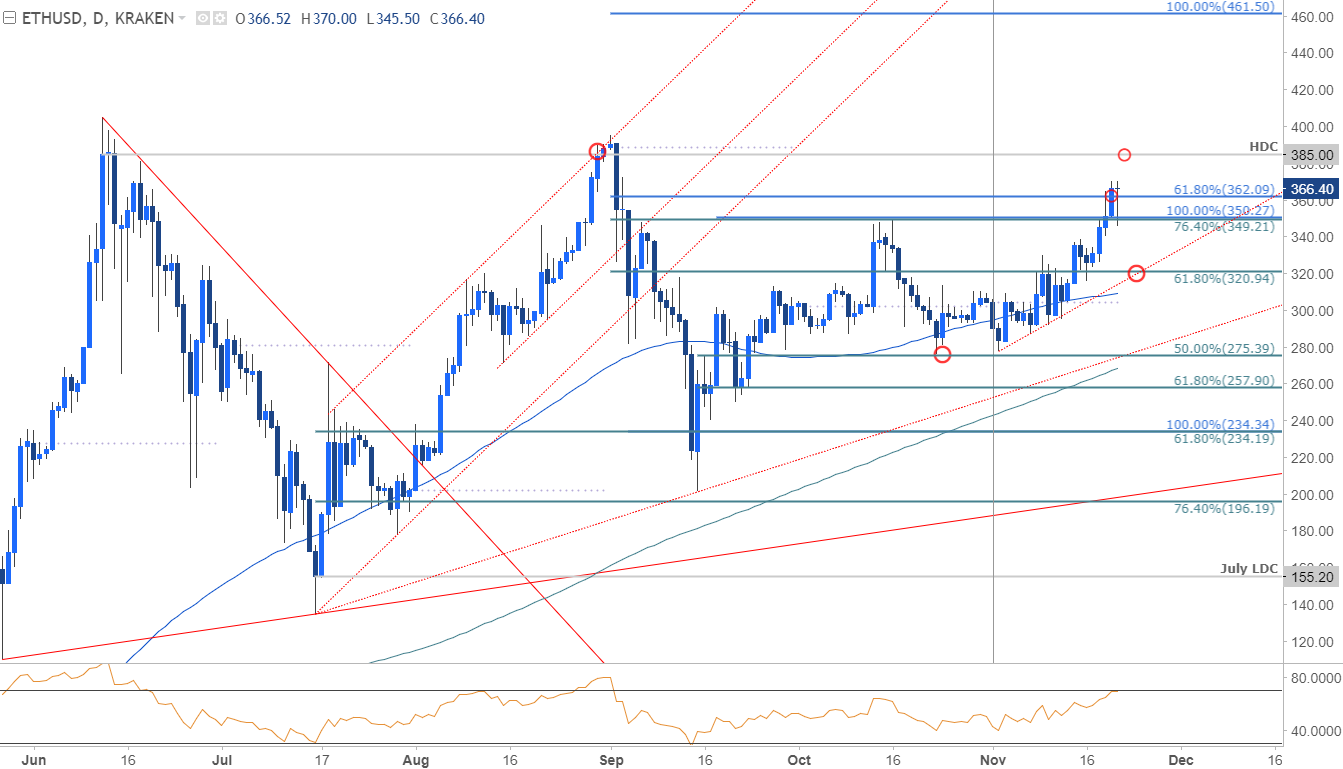
Technical Outlook: We've been tracking this rally in Ethereum prices since the breach above the November opening range385 backed by the record high at 405. Interim support now rests back at 349 with bullish invalidation now raised to 315/20. A break below the monthly open at 304 would be needed to put the bears in control.
ETH/USD 240min Chart
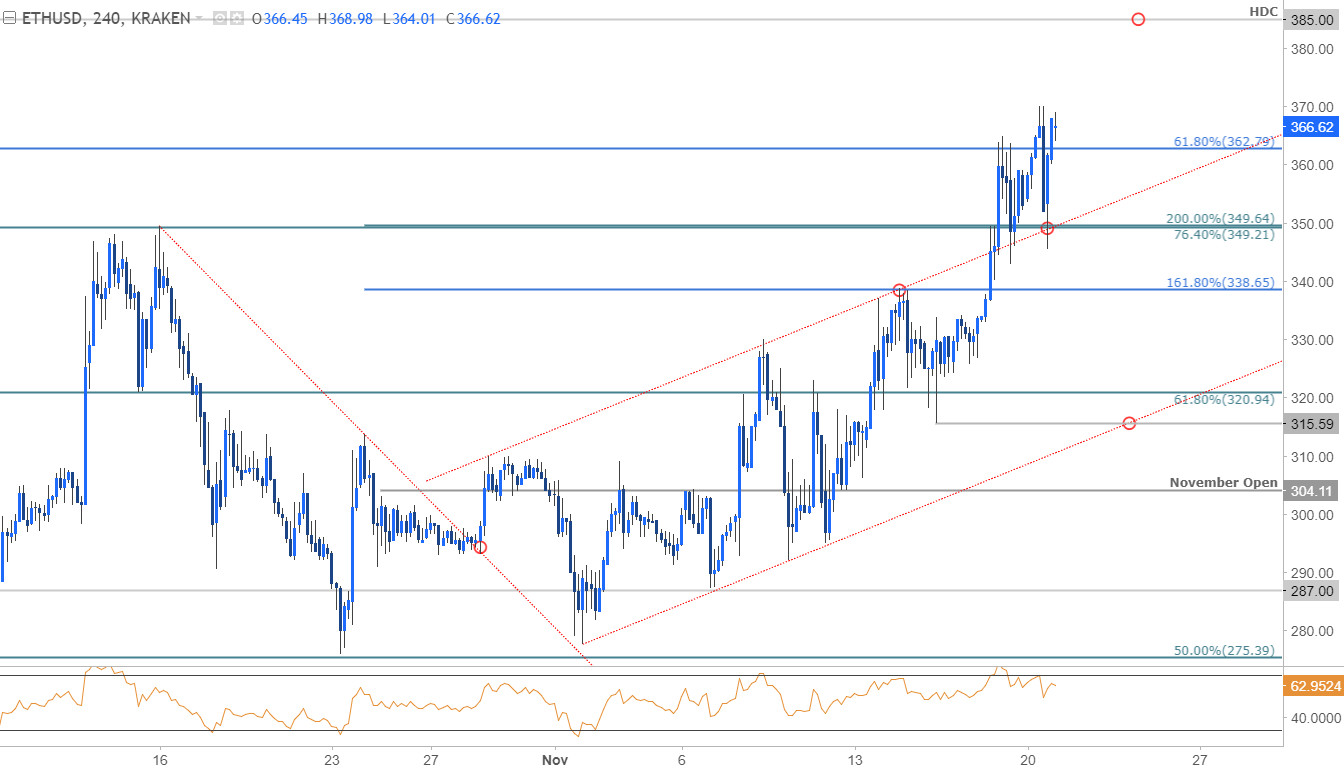
Notes: A closer look at price action shows Ethereum breaking above channel resistance before checking this slope as support last night. Note that the near-term momentum profile looks a bit tired here and leaves the immediate advance vulnerable. Bottom line: while we could see some pullback from here, the outlook remains weighted to the topside and we'll favor fading weakness while above 315.

