There was a time not too long ago when technical indicators worked just like they were supposed to. Momentum divergences foretold trend changes. Volume kept pace with rallies as they rumbled on. Breakouts from patterns either resulted in immediate rallies for us to buy or, in the worst-case scenario, they failed right away for a quick stop out and a small loss.
Tutorial: Technical Indicators And Oscillators
In January and early February of 2007, the stock market sported every divergence in the book but kept chugging higher. Pattern breakouts occasionally failed, shaking many traders out before the stock took off.
However, despite these conditions, following the charts of individual stocks, buying breakouts with no questions asked and honoring stops religiously produced impressive results. The icing on the cake was being in several stocks only days before takeover deals were announced and gains ran up to 40% for a few days of risk. Read on for a step-by-step overview of how these returns were achieved.
The Market
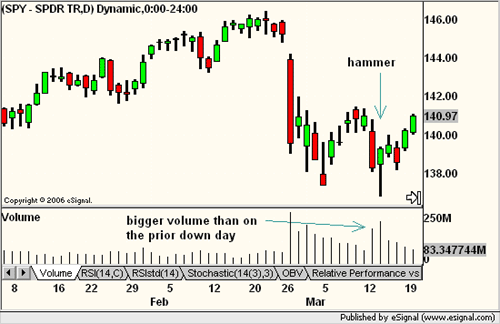
In late February 2007, when the global stock market took a temporary header following the Chinese stock market's impromptu 9% surprise, it seemed that all the frustration may finally be over. The rally had finally ended – or so it appeared.
With a nice 8% pullback in the books and a happy few weeks for the bears, even the die-hard grizzlies had to see the bullish candle formation that formed in mid-March. No problem. It seemed to be prime time for a bounce before the next leg down.

Figure 1
Source: eSignal
Volume Declines
The ensuing rally started uneventfully and, as the trend progressed, it was painfully obvious that volume was falling as prices were rising.
Why was that painful?
As many chart followers know, falling volume in a rally means that the move is unsustainable. A negative divergence was signaling caution and telling us to look for places to sell stocks, not buy them. And let's not forget that resistance levels on most major indexes loomed large. (To learn more, read Volume Rate of Change.)


