The headline, fictional, seasonally adjusted (SA) number of initial unemployment claims for last week came in at 267,000. The Wall Street economist crowd consensus guess close to the mark this week, at 272,000.
We focus on the trend of the actual data Instead of the seasonally manipulated headline number expectations game. Facts tend to be more useful than the economic establishment's favored fictitious numbers. Actual claims based on state by state filings were 230,430, which is another record low for this calendar week. It continues a nearly uninterrupted string of record lows that began in September 2013.
The Department of Labor (DoL) reports the unmanipulated numbers that state unemployment offices actually count and report each week. This week it said, “The advance number of actual initial claims under state programs, unadjusted, totaled 230,430 in the week ending July 25, a decrease of 32,519 (or -12.4 percent) from the previous week. The seasonal factors had expected a decrease of 43,528 (or -16.6 percent) from the previous week. There were 257,625 initial claims in the comparable week in 2014. ”

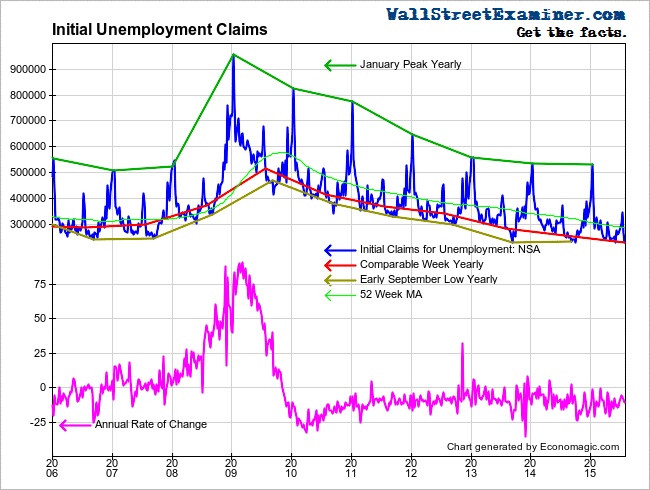
Initial Claims and Annual Rate of Change- Click to enlarge
You can see for yourself from the chart just how extraordinarily low these numbers are.
When using actual data we want to see if there's any evidence of trend change. Thus we look at how the current week compares with this week in prior years, and whether there's any sign of change. The actual change for the current week was a decrease of -32,500 (rounded). This week of July always has a large drop. Based on the data for this week from the last 10 years, the current decline was not very good, stronger than only last year (-29,500), and the same week in 2008 (also -29,500). In 2008 the economy was collapsing. The 10 year average decline for this week was -70,000.
Is this weakness material? Week to week changes are noisy. The trend is what is important and it remains on track. Actual claims were 10.6% lower than the same week a year ago. Since 2010 the annual change rate has mostly fluctuated between -5% and -15%. This week's data was right in the middle of that range. There's no sign yet of a significant uptick in the trend of firings and layoffs.
Population has been growing and the size of the workforce has as well, although not as fast as population. To get a better idea of how the claims data is performing over time, I normalize it based on the size of monthly nonfarm payrolls. Here's where we can see just how extraordinary the current levels are. There were 1,613 claims per million of nonfarm payroll employees in the current week. This was a record low for that week of July, well below the 2007 previous record of 1,889. The 2007 extreme occurred just before the carnage of mass layoffs that was to begin a couple of months later. Employers were still clueless that the end of the housing bubble would have devastating effects. If they were clueless then, they are in an advanced state of delirium and delusion now.


