from the St Louis Fed
— this post authored by Michael McCracken, Assistant Vice President and Economist
The Federal Reserve has a dual mandate from Congress loosely stated as “full employment” and “price stability.” There are many ways to define and evaluate these mandates, but most share one thing in common: They consider the U.S. as a whole, ignoring any idiosyncrasies present among regions, states and even cities.

As such, it is possible that monetary policy works on aggregate despite not having the intended effects in a particular geographic portion of the country.
Inflation across Regions
In a 2015 post, Alejandro Badel and Joseph McGillicuddy investigated the differences in consumer price index (CPI)-based inflation rates across the four Census regions:
At that time, aggregate inflation for the nation was slightly above zero, but among the four regions, only the West region exhibited positive levels of inflation. The other three regions had essentially zero inflation or were even exhibiting a bit of deflation.
These differences were largely the result of higher energy- and shelter-driven inflation in the West region. Obviously, national inflation reports need not accurately represent price movements in any specific part of the country.
Inflation across Cities, Regions and the Nation
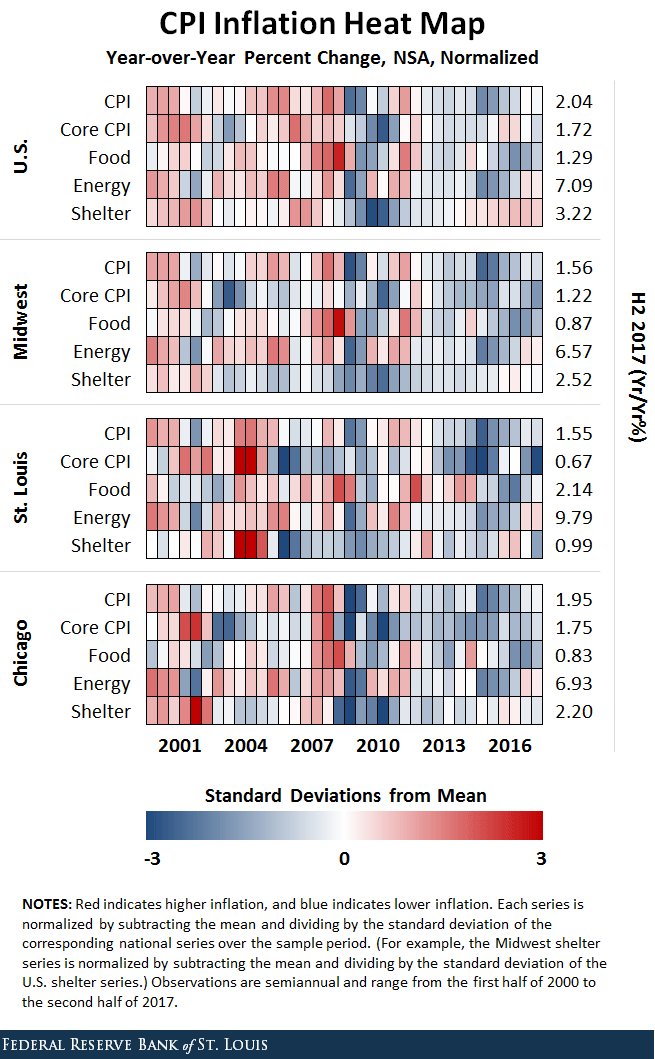
We made a comparable analysis but narrowed our focus to the metro areas of St. Louis and Chicago relative to the Midwest region and the nation as a whole.2 We used a heat map of inflation constructed separately for each geographic area.

Since data on aggregate prices for cities are available only twice a year (first and second half of the year), we constructed an element for each release for each region.
Putting Together the Analysis
As an example of how we constructed the map, consider CPI-based inflation for the U.S. as a whole. Each element of the top row represents a colorized version of the year-over-year CPI-based inflation rate for that half-year after subtracting the mean and dividing by the standard deviation of the series over the entire 2000-2017 period.


