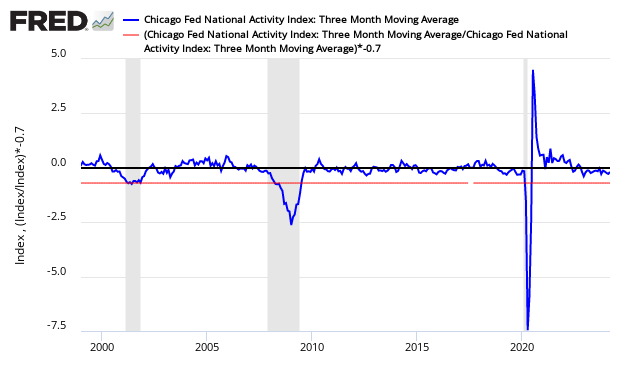
The economy's growth declined marginally based on the Chicago Fed National Activity Index (CFNAI) 3 month moving (3MA) average – and remains below the historical trend rate of growth (but still well above levels associated with recessions).

The three month moving average of the Chicago Fed National Activity Index (CFNAI) which provides a summary quantitative value for all the economic data being released – declined from -0.18 (originally reported as -0.20 last month) to -0.20. Three of the four elements of this index are in contraction.
PLEASE NOTE:

A value of zero for the index would indicate that the national economy is expanding at its historical trend rate of growth, and that a level below -0.7 would be indicating a recession was likely underway. Econintersect uses the three month trend because the index is very noisy (volatile).
CFNAI Three Month Moving Average (blue line) with Historical Recession Line (red line)

As the 3 month index is the trend line, the trend is currently showing a marginally decelerating rate of growth. As stated: this index only begins to show what is happening in the economy after many months of revision following the index's first release.
CFNAI Three Month Moving Average Showing Month-over-Month Change

The CFNAI is a weighted average of 85 indicators drawn from four broad categories of data: 1) production and income; 2) employment, unemployment, and hours; 3) personal consumption and housing; and 4) sales, orders, and inventories.


