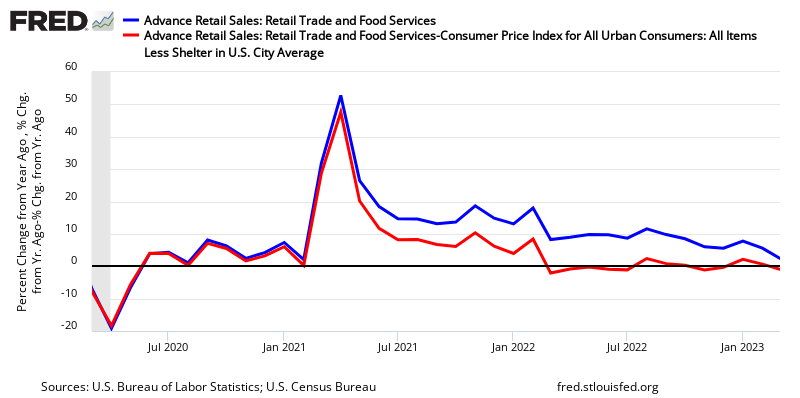
retail sales improved according to US Census and well above expectations. Our analysis slightly disagrees – but the unadjusted data in this series is like riding a roller coaster. Because of the noise in this series, it is better to view the 3 month rolling average of sales growth which improved marginally (driven to a large part by backward revision).

Econintersect Analysis:
unadjusted sales rate of growth decelerated 1.5% month-over-month, and up3.7% year-over-year.
unadjusted sales 3 month rolling year-over-year average growth accelerated0.1% month-over-month to 4.7% year-over-year.
Advance Retail Sales Year-over-Year Change – Unadjusted (blue line), Unadjusted with Inflation Adjustment (red line), and 3 Month Rolling Average of Unadjusted (yellow line)

/images/z retail1.png
unadjusted sales (but inflation adjusted) up 2.4% year-over-year
backward revisions were upward;
this is an advance report. Please see caveats below showing variations between the advance report and the “final”.
in the seasonally adjusted data – almost all areas were strong this month for retail sales growth, with only miscellaneous retailers and gasoline stations being the headwinds month-over-month.
u.s. Census Headlines:
seasonally adjusted sales up 0.7% month-over-month, up 5.1% year-over-year
the market was expecting:
| seasonally adjusted |
Consensus Range |
Consensus |
Actual |
| Retail Sales – M/M change |
0.1 % to 0.7 % |
0.4% |
0.7% |
| Retail Sales less autos – M/M change |
-0.1 % to 0.4 % |
0.1% |
0.5% |
| Less Autos & Gas – M/M Change |
0.3 % to 0.8 % |
0.5% |
0.6% |
Year-over-Year Change – Unadjusted Retail Sales (blue line) and Inflation Adjusted Retail Sales (red line)

Retail sales per capita seems to be in a long term downtrend (but short term trends vary depending on periods selected – see graph below).


