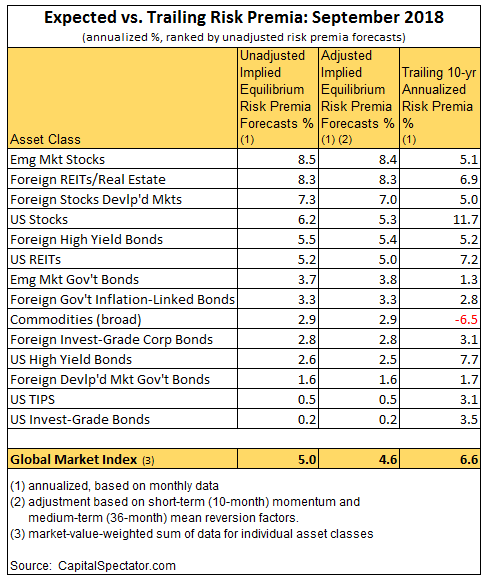
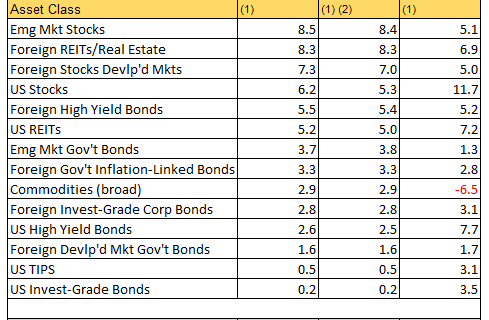
The expected risk premium for the Global Market Index (GMI) was unchanged in September, holding steady at an annualized 5.0% — matching the estimate in the previous month. The performance forecast for GMI (an unmanaged market-value-weighted portfolio that holds all the major asset classes) reflects premium over the projection for the “risk-free” rate for the long run.
Adjusting for short-term momentum and medium-term mean-reversion factors (defined below) trim's GMI's ex ante risk premium to an annualized 4.6%, which is also unchanged from August.
Both estimates remain moderately below GMI's historical performance for the trailing 10-year period through last month. The benchmark earned an annualized 6.6% risk premium for the decade through September 2018, well above the current 5.0% long-run forecast for GMI.
The forecasting engine for the forward-looking estimates is an equilibrium methodology (defined below) that uses three inputs: risk (return volatility), the relationship of assets (return correlation), and an assumption of GMI's expected market pricing of risk (Sharpe ratio). The data is based on historical market results starting in December 1997 — the earliest date that offers prices for all the major asset classes (e.g., inflation-indexed Treasuries began trading in the late-1990s). The “risk-free” rate is defined as the yield on zero-to-three-month Treasury bills.

All forecasts are likely to be wrong to some degree, but the projections for GMI are expected to be somewhat more reliable vs. the estimates for the individual asset classes. Predictions for the market components are subject to greater uncertainty compared with aggregating forecasts, a process that may cancel out some of the errors through time.
For historical context, here's a chart of rolling 10-year annualized risk premia for GMI, US stocks (Russell 3000), and US Bonds (Bloomberg Aggregate Bond) through last month. Note that GMI's current 10-year performance (red line) has recently exceeded the previous peak of 6.0% reached in 2013.


