
Given strategist and investor concern surrounding the economy, the following charts can provide insight into whether or not the onset of a recession is forth coming.
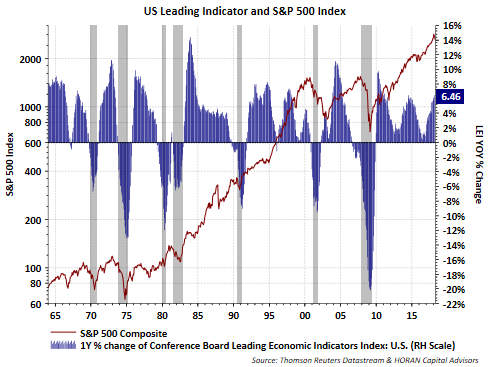
The shaded areas in the below chart represent recessionary periods in the U.S and the S&P 500 Index (maroon line) clearly takes a turn to the downside during these recession periods. Also, noteworthy on the chart is the continued increase in the year-over-year percentage change in the Leading Economic Indicator, an indication of continued economic strength. More information on the composition of the LEI can be read on The Conference Board's website. In the Conference Board's latest press release, they note:
“The U.S. LEI rose again, despite a sharp downturn in stock markets and weakness in housing construction in February,” said Ataman Ozyildirim, Director of Business Cycles and Growth Research at The Conference Board. “The LEI points to robust economic growth throughout 2018. [emphasis added] Its six-month growth rate has not been this high since the first quarter of 2011. While the Federal Reserve is on track to continue raising its benchmark rate for the rest of the year, the recent weakness in residential construction and stock prices – important leading indicators – should be monitored closely.”

The Federal Reserve is in the process of normalizing interest rates with 2-3 more rate increases anticipated this year. The Fed Funds rate is now at a level that was reached coming out of the recession that resulted from the bursting of the technology bubble in 2000. Since 1950, every recession has been preceded by a Fed Funds rate rise. The early stages of rate increases tend to not create difficulties for the economy as the Fed simply desires to get short term interest rates to a more normal level. It is later increases, that when pursued, generally are being implemented with the stated intent to slow economic activity and reduce inflationary pressures.


