Investors and traders were quite optimistic early Friday, as the Dow Industrials soared close to 300 points in early trading. For a few hours, it seemed that many had forgotten the heavy selling that occurred on Monday. In my view, it was the decline on Monday that set the tone for the entire week, and I apparently was not alone, as the last hour sell-program on Friday of $3.4 billion erased most of the day's gains.

(Photo by Drew Angerer/Getty Images)
So does last week's action change the market's outlook? Let's look at three of the major averages.
From a technical standpoint the market declines last week were not that surprising, as a week ago the Spyder Trust (SPY) had generated a weekly doji sell signal. As I discussed in more detail on Tuesday (Weekly Candle Charts Warned Of Monday's Drop), a doji occurs when an ETF or market average opens and closes at nearly the same price. After a sustained rally, a close below the doji low then generates a more significant sell signal.

TomAspray-ViperReport.com
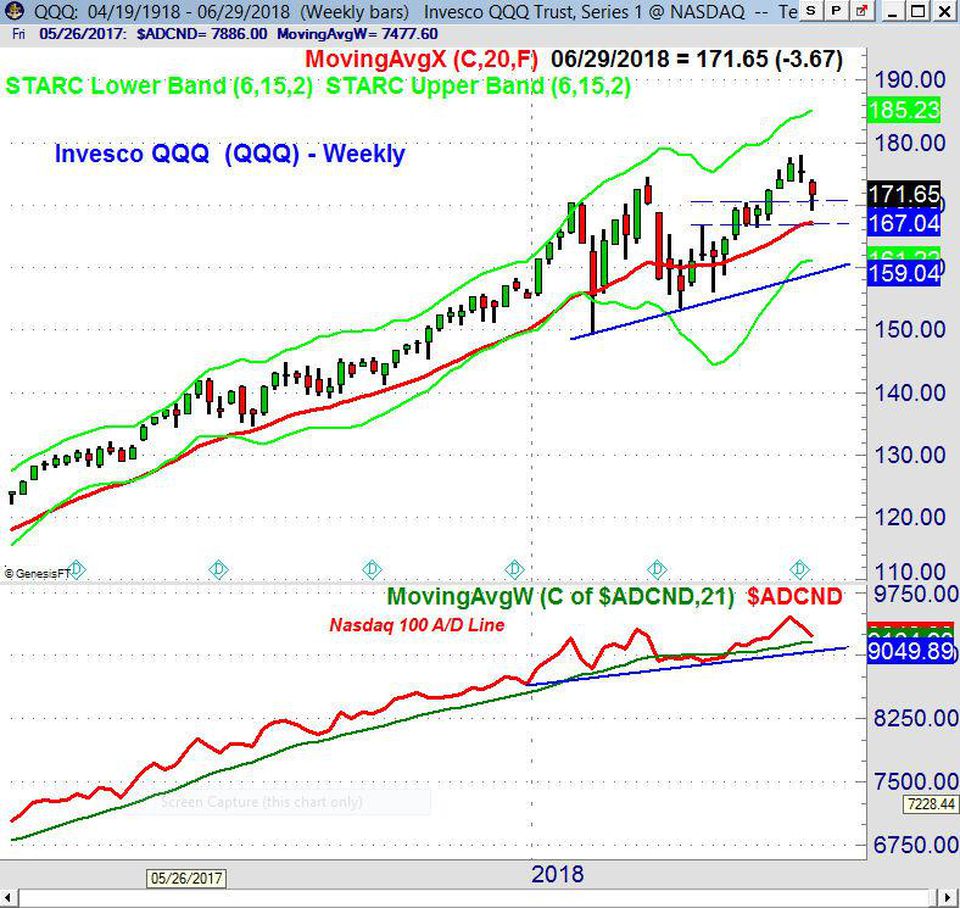
Before stocks opened Monday, I also felt it was significant that the Invesco QQQ Trust (QQQ) had formed a weekly doji with the close on June 22nd. The QQQ closed on Friday at $171.65 which was well below the prior week's doji low of $173.71, so it also triggered a weekly doji sell signal.
The Friday close was below the new monthly pivot for June at $172.93, which is a sign that the correction is not over. The QQQ dropped into my previously-identified support zone at $170.57-$166.93. There is June pivot support at $167.89, with the tentative third quarter pivot at $167.72, which is the level to watch on this Friday's close.
The intermediate term trend analysis is positive, as the weekly Nasdaq 100 Advance/Decline line made a new high a week ago, and while it has turned down, it is still well above its rising WMA. The daily Nasdaq 100 A/D line (not shown) has dropped below its WMA, which is consistent with a further correction. For the quarter, QQQ was up 7.4% and is up 10.6% YTD.


