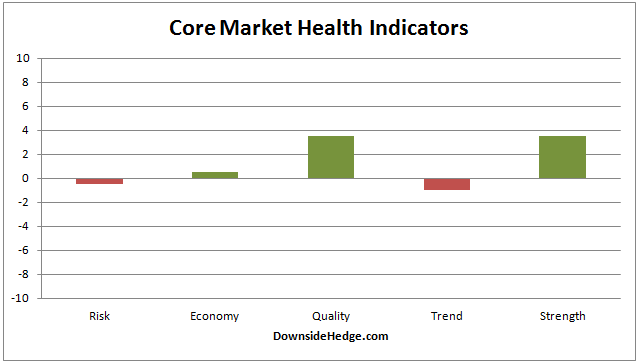
Over the past week most of my core market health indicators improved. However, none of them moved enough to change the core portfolio allocations. This is a little discouraging given the fact that the S&P 500 Index (SPX) has rallied sharply. The overall picture I'm seeing is a thinning market that is trying to recover. Which is in line with a modest hedge or a moderate amount of cash for a cautious investor. Aggressive investors would be more comfortable riding out dips unless they are accompanied by high risk (Volatility Hedge). Below are the current allocations.
Long / Cash portfolio: Long 60% – Cash 40%
Long / Short portfolio: Long 80% – Short 20%
Volatility Hedge: 100% Long

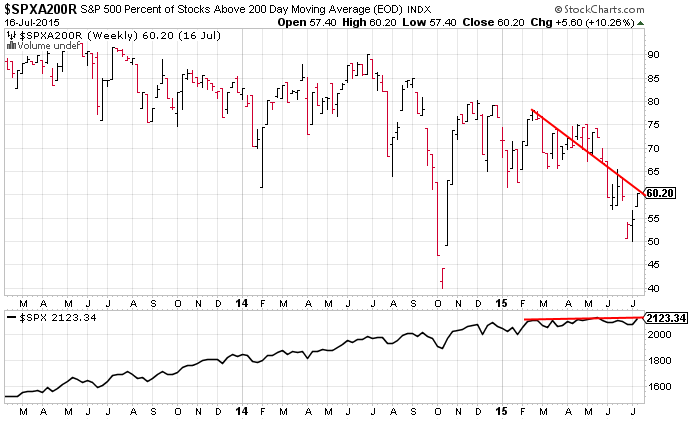
The percent of stocks in SPX that are above their 200 day moving average has recovered from 50% back to 60%. This is a small positive sign that indicates some value buying is occurring (rather than dumping stocks as they break below their 200 dma). Unfortunately, the market has 15% fewer bullish stocks than it had the first time current price levels were reached. Keep an eye on this indicator as the market rallies. It should strengthen in a healthy rally.

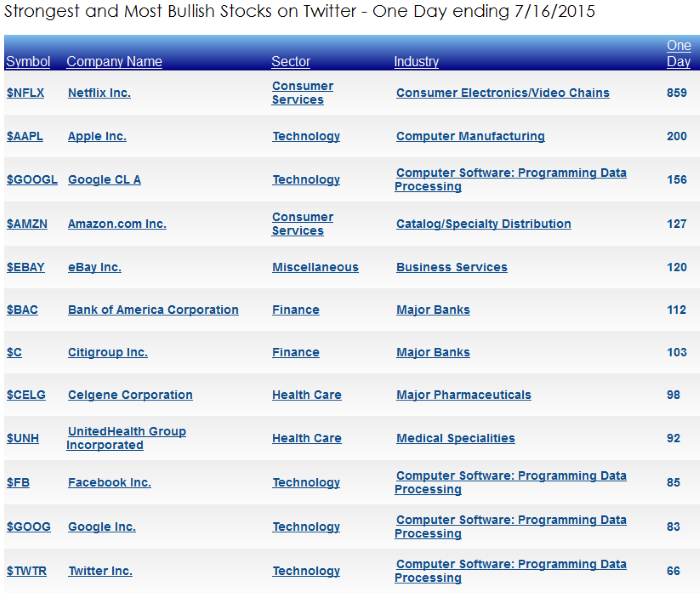
Another encouraging sign comes from the most bullish stocks on Twitter. Over the past few weeks the daily list has been lead by technology, biotech, and financials. The individual stocks in the list are what we want to see during a healthy rally. It remains to be seen if the buying expands to more stocks or starts thinning again. You can see the list of bullish stocks on Twitter over several time frames here. Another way to make a quick check of the number of bullish stocks can be seen in this interactive chart. The breadth chart is currently showing the number of bullish stocks dropping, but the number of bearish stocks isn't rising rapidly. This indicates bullish to neutral sentiment from the Twitter stream.

Conclusion


