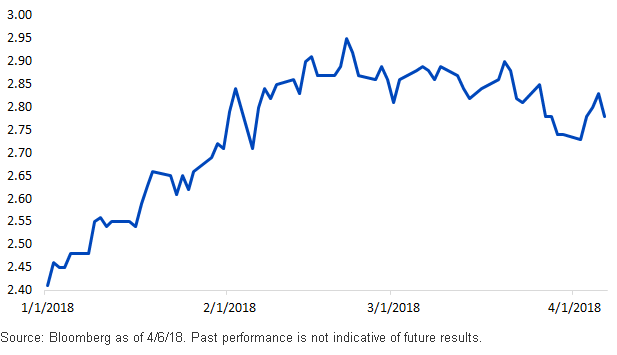
For the first time in 2018, investors have been able to take a breath with respect to the u.s. Treasury (UST) market. Indeed, after a tumultuous first six weeks or so of the year, the UST 10-Year yield appears to have settled into more of a range-bound pattern, rather than the relatively one-way trade to the upside that was the predominant trend through mid- to late February.
The graph below provides a clear illustration of how rate movement for the UST 10-Year has transpired as we turned the calendar to the first week of April. To begin the year, the yield rose 54 basis points (bps) to a high point of 2.95% on February 21, but during March and into the first week of April, the UST 10-Year settled into a trading range of essentially 2.70% to 2.90%.
U.S. 10-Year Treasury Yield

Is this the “new normal” for the UST market or are investors just biding their time before the next significant move either to the upside or—a possibility that nobody seems to be anticipating—to the downside? To be sure, as I have discussed previously, once again consensus forecasts for the UST 10-Year yield anticipated another increase for 2018, and, thus far, they have proven relatively accurate. Heading into this year, the consensus estimate placed the 10-Year yield at 2.88%, right within the realm of where trading has been taking place of late, and only 7 bps from the aforementioned peak.
Given the swift move to the upside, consensus forecasters went back to the drawing board and updated their expectations for where the UST 10-Year yield will reside in the fourth quarter. According to this Bloomberg consensus, the figure has been revised up by 27 bps to 3.15%.
Where does WisdomTree fall into this debate? We are in agreement that the 10-Year yield will be operating in a new, elevated trading range. In our opinion, it is more useful to think of rates in a range rather than as a “point estimate,” because, as we have seen over recent years, the dynamics can change quickly. In other words, you might hit your forecast right on the button, but six weeks later, the market has moved visibly away from your projection. Against this backdrop, we see the UST 10-Year yield trading in a 2.50% to 3.25% band in 2018 versus the 2.00% to 2.65% actual range from a year ago.


