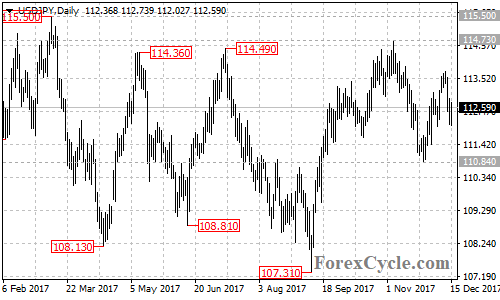
USD/JPY moved sideways in a trading range between 110.84 and 114.73. As long as 110.84 support holds, the sideways movement could be treated as consolidation of the uptrend from 107.31.
A breakout of 115.50 resistance will indicate that the long term uptrend from 98.97 (Jun 24, 2016 low) has resumed, then a further rise towards 118.66 (Dec 15, 2016 high) could be seen. On the downside, a breakdown below 110.84 support could bring price back to next support level at 109.50, followed by 107.31.


