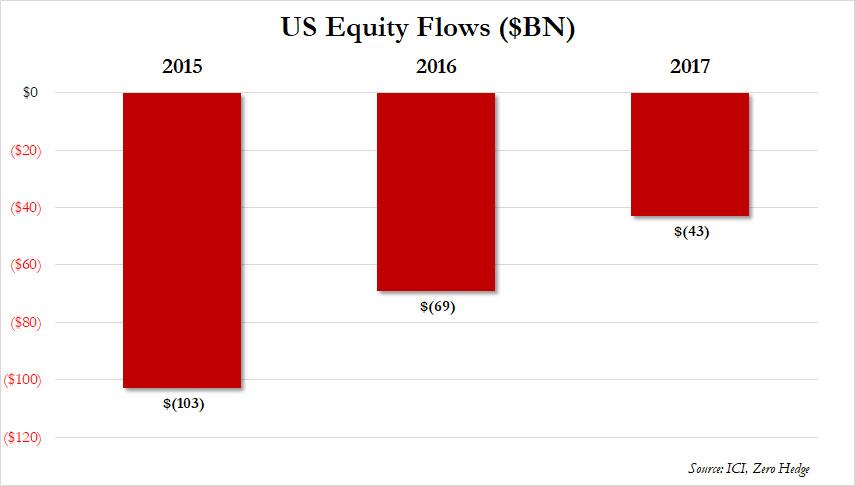
In fact, as the chart below shows using data from the Investment Company Institute, or ICI, as the market continued to levitate over the past the years, over $200 billion in funds have flown out of US equities.

How is this possible?
There is still no satisfactory answer, but to DataTrek's Nicholas Colas this bizarre juxtaposition of ongoing outflows from mutual funds and ETFs with a market at all time highs, is why this remains “the most hated rally in history.” It is also why what until years ago was financial anathema, namely the suggestion that central banks manipulate stocks, is now widely accepted as a daily feature of the global capital markets. Because after all, if everyone is selling, someone else surely has to be buying?
Meanwhile, for those who still harbor hope that logic will eventually prevail, here is an attempt by Nick Colas to explain what may be the biggest market conundrum of all.
The most hated rally in US stock market history lives on, but why does this moniker even apply? A quick look at some fund flow data from the Investment Company Institute, which includes mutual and exchange traded funds, tells the story:


